Climate Risk Overview
The climate crisis has begun — adaptation solutions reflecting the characteristics of Gyeonggi-do.
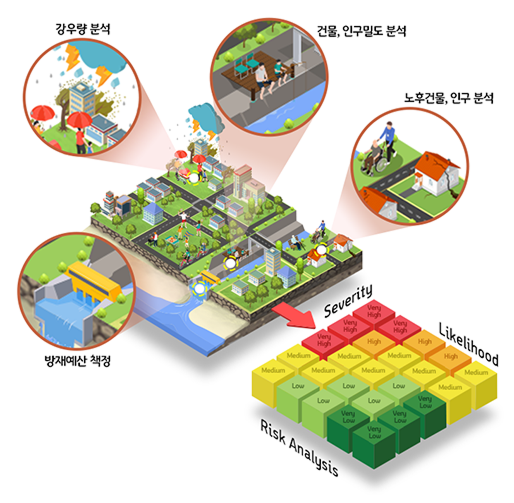
To minimize the real damage caused by the climate crisis, Gyeonggi-do requires its own adaptation strategy that reflects its unique topography, climate, urban structure, and demographic characteristics. The platform provides comprehensive information, including heatwave intensity evaluation through 3D simulations, flood risk analysis based on actual disaster data, AI-based landslide risk ratings, and profiles of vulnerable populations by age, health, and income. This information forms the foundation for effective adaptation strategies and supports scientific decision-making.
Climate Change Current Status in Gyeonggi-do
In 2024, for the first time in Korea Meteorological Administration records, the national annual average temperature exceeded 14°C. In 2023, Gyeonggi-do recorded the coldest winter in the past five years. According to the Meteorological Data Open Portal, Gyeonggi-do’s average temperature has also been rising annually.
- Automated Synoptic Observing System (ASOS) is an automated system that measures various weather elements such as temperature, pressure, wind, humidity, precipitation, and solar radiation with high precision. Installed at major observation sites nationwide, it serves as the standard for national weather observation. Data collected simultaneously is used for forecasts, climate statistics, and climate change analysis.
- Major greenhouse gases such as CO₂ and CH₄ are measured in real time at monitoring stations in Gimpo and Pyeongtaek, enabling close observation of climate change trends.
Temperature
Rainfall
이산화탄소 농도
Future Climate Change Scenarios for Gyeonggi-do
Climate change scenarios (SSP-RCP) combine socioeconomic pathways—such as population, economy, and energy—with greenhouse gas concentration pathways to project future climate conditions. Based on these, Global Climate Models (GCMs) scientifically simulate changes in temperature, precipitation, and other factors for 2050 and 2100.
It provides future climate information by incorporating the impacts of anthropogenic factors, such as greenhouse gases and aerosols. This information can be used by Gyeonggi-do to anticipate and minimize the potential damages from climate change.
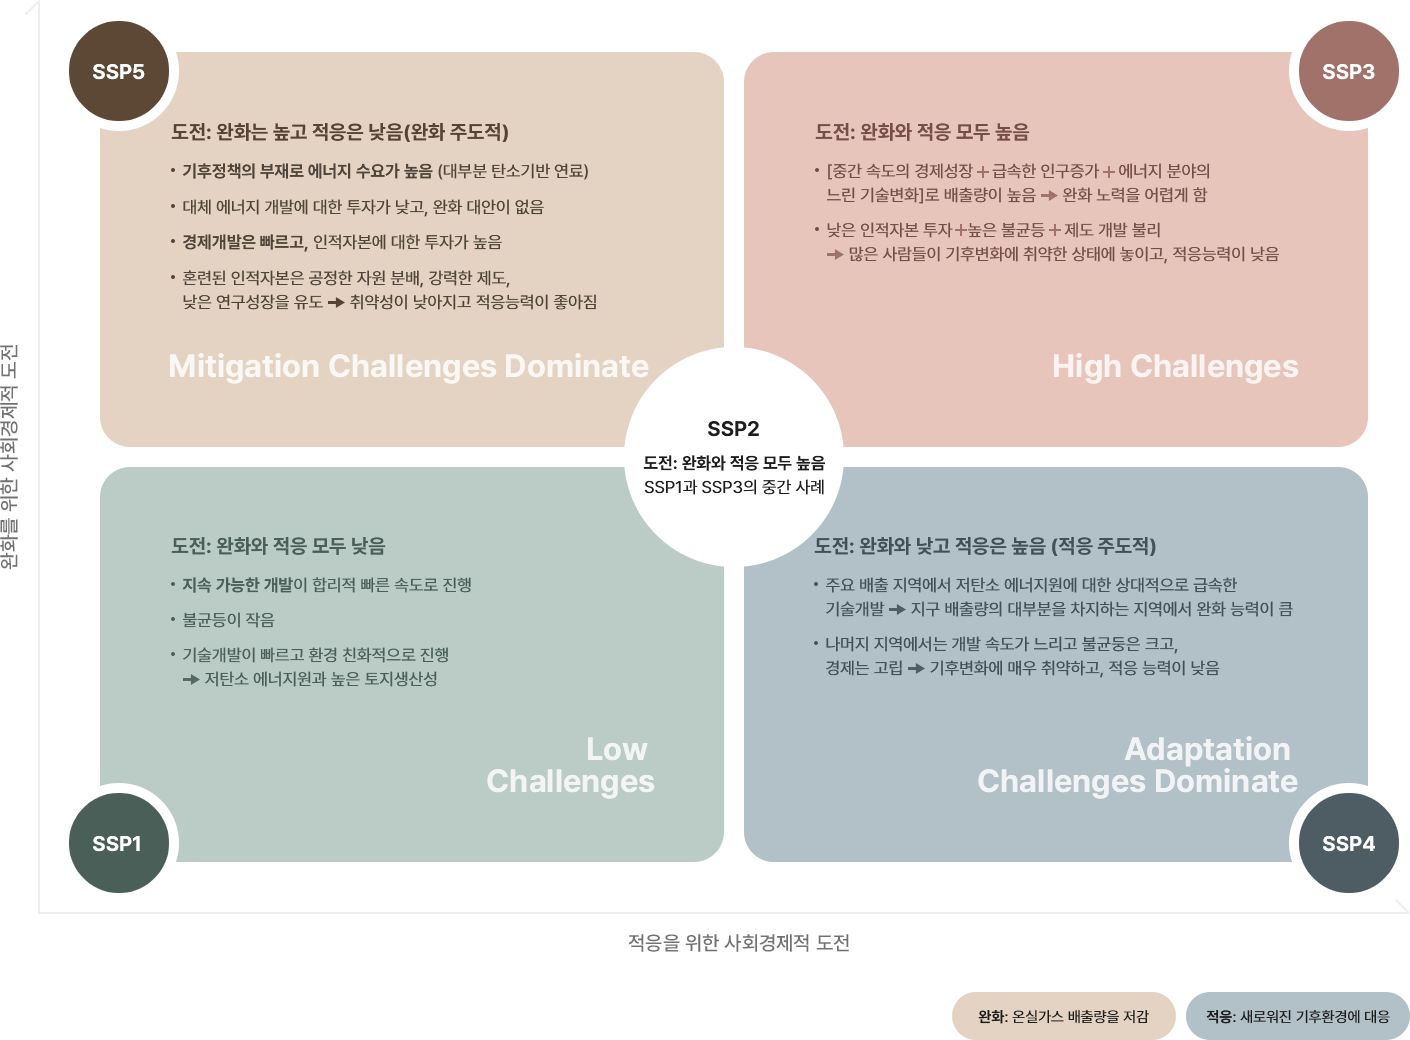
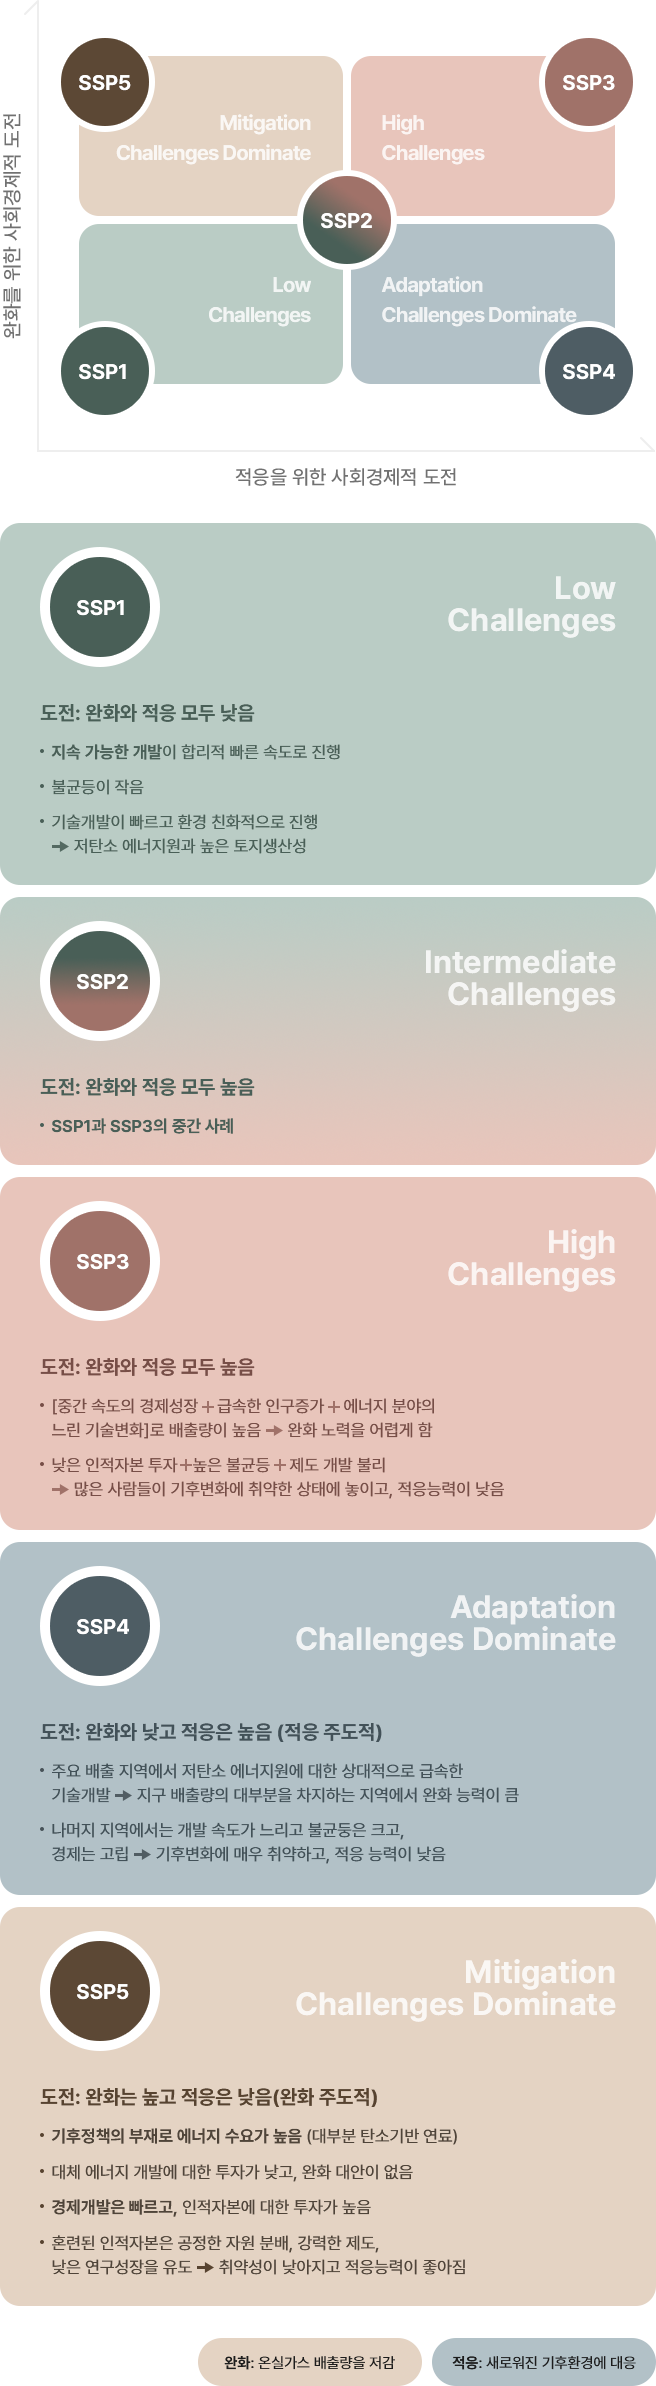
SSP (Shared Socioeconomic Pathways) Scenario
The SSP scenario, used in the IPCC 6th Assessment Report (2021), is a framework developed to explain the socioeconomic context of climate change based on changes in social, economic, educational, and technological factors. SSP is structured to comprehensively explore how climate change interacts with society, economy, and technological development. Five representative pathways (SSP1–SSP5) are presented. Combined with the RCP scenarios, SSP is used to analyze diverse climate change scenarios, contributing to a detailed understanding of the causes and effects of climate change.
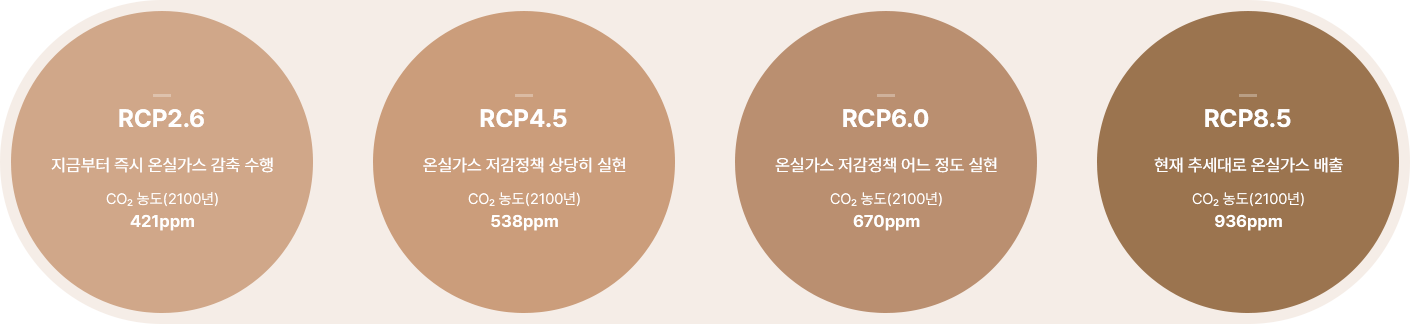
1) RCP (Representative Concentration Pathway) Scenario
The RCP scenario, used in the IPCC 5th Assessment Report (2013), is a set of representative greenhouse gas concentration pathways established to predict future climate change. RCP presents multiple pathways based on the radiative forcing level (W/m²) up to 2100, with RCP2.6, RCP4.5, RCP6.0, and RCP8.5 as representative examples. These scenarios are used to scientifically analyze climate responses to changes in greenhouse gas concentrations.
SSP-RCP scenario analysis case
1 /
Scenario Analysis Conditions
SSP Scenario
기후요소
기본요소
극한기후지수(고온)
극한기후지수(저온)
극한기후지수(강수)
영향정보(농업)
영향정보(산림)
영향정보(보건)
SSP1-2.6 재생에너지 기술 발달로 화석연료 사용이 최소화되고 친환경적으로
지속가능한 경제성장을 이룰것으로 가정하는 경우
지속가능한 경제성장을 이룰것으로 가정하는 경우
Ranking by Administrative Districts in Gyeonggi-do
Assumes environmentally sustainable economic growth with the development of renewable energy technology and minimal use of fossil fuels (low-carbon scenario)
Climate Crisis Status in Gyeonggi-do
‘Heavy snow exceeding 40 cm’, ‘Emergency response Level 3 for the first time in 12 years’, ‘Yeoju, Gyeonggi-do 40°C’. Summer and winter in Gyeonggi-do are breaking records daily. Representative climate crisis phenomena due to extreme climate change include heavy rain, heat waves, and landslides.
Heat Wave
Recently, the number of heat-related illnesses and casualties caused by heat waves has been increasing. Between 2011 and 2022, the average annual increase rate of heat-related illnesses in Gyeonggi-do was 3.5%, while the average annual increase rate over the past three years (2020–2022) was 24.9%, indicating a sharp rise in heat-related illnesses.
Flood
Damage from extreme rainfall was particularly severe in 1998, 2011, and 2022. In 1998, total damage reached 500 billion won, and in 2011, approximately 24,000 people were affected, indicating substantial loss of life. In 2022, large-scale extreme rainfall caused additional damage, totaling approximately 200 billion won.
Landslide
Most landslides in Gyeonggi-do occur during heavy rain periods from June to October, showing clear regional concentration rather than annual variation. From 2018 to 2024, landslides occurred at 1,628 sites, with recent intensive occurrences in Icheon-si, Yangpyeong-gun, and Anseong-si.
Heat Wave
Heat Wave Occurrence in Gyeonggi-do
(2020-2024)
0
DaysHeat-related Illness Patients in Gyeonggi-do
(2021-2023)
0
PersonsIncrease Rate of Heat-related Illnesses in Gyeonggi-do
(2021~2023)
0
%Heat-related Illness Mortality Rate in Rural Areas Compared to Urban Areas
(National Average) 0.9%)
0
%Highest Temperature in Gyeonggi-do(ASOS)
(2021-2025)
0
°CHeat Wave
A heat wave occurs when the day's highest perceived temperature stays at 33°C or above for more than two days. From 2026, the Korea Meteorological Administration has overhauled its heat-wave alerts for the first time in 18 years, adding a top-tier 'Severe Heat-wave Warning' to the existing two-level 'Advisory·Warning' system for a three-level system. An advisory is issued at a perceived 33°C, a warning at 35°C or above for two or more days, and a severe warning when a perceived 38°C or above (or an air temperature of 39°C or above) is forecast even for a single day; a new 'Tropical-night Advisory' has also been added. Vulnerable groups such as the elderly, infants, low-income populations, and outdoor workers face a growing heat threat each year.
Gyeonggi-do is seeing heat waves increase rapidly due to climate change. In 2025, Gyeonggi-do recorded 978 heat-related illness cases, the most in the nation, and both heat-wave days and tropical nights continue to rise. Yet even within the same city, heat varies greatly from place to place. Even at the same midday, a shadeless asphalt road and a tree-lined walkway feel completely different. But because today's heat-wave alerts are issued with a single standard over broad areas, they cannot convey the heat differences down to the alleys of our own neighborhood.
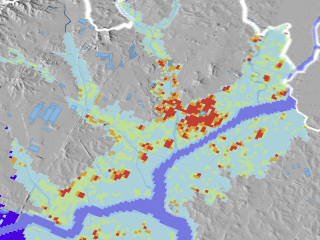
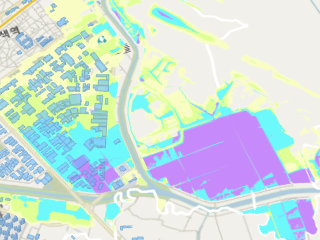
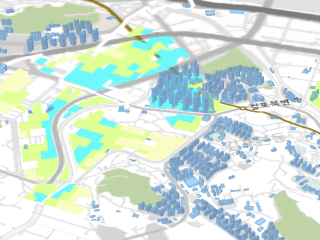
To fill this gap, our platform used a 3D city model built with airborne LiDAR and a solar-radiation analysis model (SOLWEIG-GPU). By calculating the shade cast by buildings and trees as well as the heat rising from the ground, it analyzed the heat that the outdoor population actually receives at a 5m grid resolution (precise enough to distinguish even a single street tree). Rather than air temperature alone, this map shows the 'heat people actually feel (Mean Radiant Temperature)', reflecting humidity, wind, sunlight, and building shade.
This means alley-level heat-risk spaces exist in every area. Through this map, local governments can pinpoint exactly where shade canopies, cooling, and urban greening are truly needed, and citizens can check in advance where it is hot or cool in their neighborhood to avoid the heat safely.
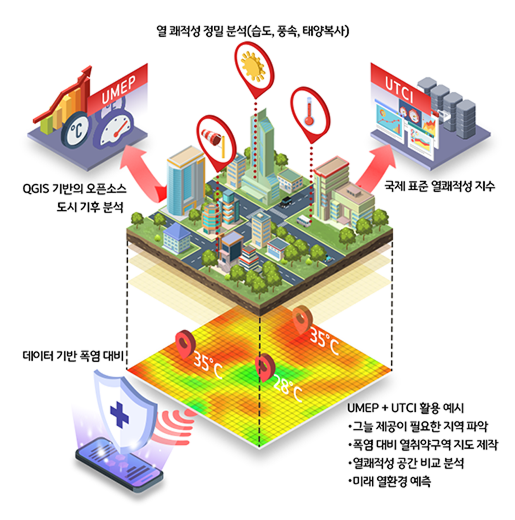
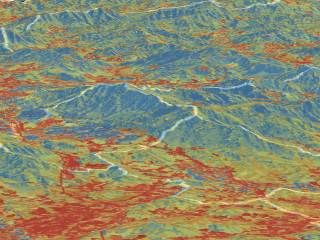
The Mean Radiant Temperature 10-grade rating is a scientific analysis of pedestrians' thermal environment across all of Gyeonggi-do. By comprehensively reflecting temperature, humidity, wind speed, solar radiation, and building shade onto 3D building and terrain data built with airborne LiDAR, it analyzed the heat that the outdoor population actually receives (Mean Radiant Temperature) at a 5m grid resolution and rated it on a 10-level scale by city/county. This allows precise identification of heat-wave-vulnerable areas down to the alley level and the establishment of customized response policies.
Data 02
Heat Intensity During Heatwave (Mean Radiant Temperature)
OPEN & Share 바로가기
Go to Climate Map
데이터 작성방법
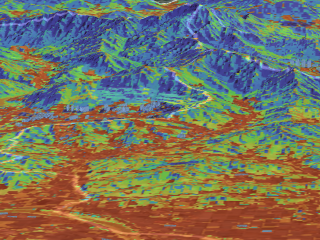
Using the SOLWEIG-GPU solar-radiation model, this represents the thermal environment of the outdoor population across all of Gyeonggi-do at a 5-10m grid resolution, comprehensively considering temperature, humidity, wind speed, solar radiation, and building shade. It is the Mean Radiant Temperature (Tmrt) — the heat a person receives from all directions expressed as a temperature — rather than air temperature, and it varies with where one stands even at the same moment.
Data 03
Current Status of Heat-related Illnesses
Using National Health Insurance data, we compiled heat-related illness cases by administrative district. Patients who experienced heatstroke, heat syncope, heat cramps, or dehydration-related heat exhaustion during summer were counted to create administrative district–level heat-related illness data.
Using latitude and longitude coordinates of heat shelters, we mapped the distribution and counted the number of shelters by administrative district.
1 / 4
Card Graph View
Thermal Comfort Evaluation Results
Gyeonggi-do
경기도 열쾌적성 평가 결과 통계
선택할 수 있는 데이터
Table View
Thermal Comfort Evaluation Results
Heat Wave 데이터
| 선택 문구 |
|---|
| 선택된 시군/읍면동 또는 데이터가 없습니다. 시군/읍면동 또는 데이터를 선택하여 주십시오. |
Flood
Property Damage
(2019-2023)
Approx.
0
KRW 100 MillionNumber of Affected People
(2019-2023)
0
PersonsNumber of Casualties
(2019-2023)
22
Persons (13% of Nationwide)Number of Damaged Buildings
(2019-2023)
0
동 (20% of Nationwide)Flood
Due to climate change, the frequency of flood damage caused by extreme rainfall and typhoons in Gyeonggi-do has been steadily increasing. In 2023 alone, Gyeonggi-do recorded 126 heavy-rain advisories and warnings, the highest number on record, and hourly rainfall exceeding 100 mm was also observed.
From 2007 to 2022, flood damage in Gyeonggi-do reached KRW 784 billion, the highest level nationwide. Flood damage is influenced not only by rainfall intensity but also by the scale of assets exposed to flood risk, such as buildings and farmland. In particular, areas with high concentrations of dependent populations, including infants and older adults, as well as older or semi-basement buildings, are exposed to greater risk.
To support the prevention of flood risk caused by extreme rainfall and typhoons, Gyeonggi-do systematically analyzed eight years of data from 2016 to 2023 and assessed flood risk across Gyeonggi-do at both the city/county level and the 100 m × 100 m grid level. To ensure an accurate assessment, flood risk maps for national, local, and small streams in Gyeonggi-do, along with grid data for each sub-indicator, were used so that only buildings, population, farmland, and other assets exposed to flood risk were reflected in the evaluation. In addition, for the city/county-level flood risk assessment, annual heavy-rain and typhoon damage data and a genetic algorithm-based method for deriving optimal weights were applied to scientifically estimate the actual level of flood risk in each area.
The flood risk index statistical maps provided by the Gyeonggi Climate Platform are a key tool for data-driven disaster prevention decision-making. Using these maps, local governments can prioritize limited disaster prevention budgets and personnel for areas with the greatest need and use them to provide concentrated support for vulnerable groups and establish tailored mitigation measures. They can also serve as scientific evidence for developing flood control measures in river improvement projects, apartment housing projects, and urban development projects, thereby greatly enhancing policy effectiveness.
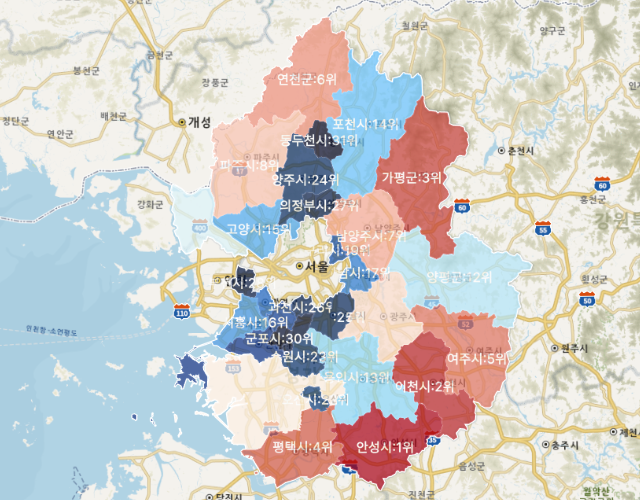
The city/county-level flood risk index is a qualitative flood risk assessment result derived using 100 m × 100 m grid data for each sub-indicator, flood risk maps, and a genetic algorithm. The index comprehensively evaluates annual flood risk at the city/county level using 11 sub-indicators, including flood risk maps for national, local, and small streams, maximum rainfall, number of buildings, farmland area, number of older buildings, and disaster prevention facility density. To improve accuracy, only assets exposed to flood risk were selected for use in the evaluation, and genetic algorithm-based optimal weights were applied to minimize the error relative to the heavy-rain and typhoon damage rankings reported in the Disaster Yearbook. The sub-indicator indices and the city/county-level flood risk index and rankings derived through this analysis provide a scientific basis for decision-making related to disaster prevention and flood control policies.
The grid-level flood risk index represents the results of annual flood risk assessments conducted from 2016 to 2023 at 100 m × 100 m grid units within the expected inundation areas around rivers in Gyeonggi-do, using grid data for nine sub-indicators and flood risk maps for national, local, and small streams under extreme rainfall events. The flood risk index is classified into 10 grades by applying entropy weights and Euclidean distance to the nine grid-level sub-indicator indices calculated for each year. The grid-level flood risk index enables the precise identification of areas with high concentrations of buildings, population, farmland, and other assets exposed to flood risk within cities and counties with high city/county-level flood risk. Because flood risk is assessed at the 100 m × 100 m grid level, the index can also be used effectively for localized disaster response and for spatially tailored policy development at the project-district level.
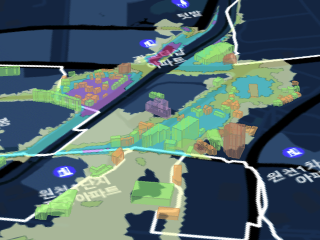
Information on flood-vulnerable facilities in Gyeonggi-do was constructed by integrating attribute data from building registration records and LiDAR-based high-resolution spatial data. Spatial information from LiDAR, including building location, height, and area, was combined with registration attributes—use, floors, structure, construction year—to identify facilities vulnerable to extreme rainfall, such as basements or old buildings. This data can support practical policy-making, including disaster response planning and prioritization of disaster prevention facilities.
Data 04
Flood Risk Map and Urban Flood Map (Ministry of Environment)
OPEN & Share 바로가기
Go to Climate Map
The Flood Risk Map visualizes the extent and depth of inundation caused by embankment failure or overtopping under extreme flood conditions that exceed the design frequency. It covers national and local rivers and provides scenario-based flood risk maps based on planned flood levels for different return periods. The Urban Flood Map shows the extent and depth of inland flooding, classified into five levels, in urban areas under the assumption that stormwater drainage systems exceed capacity or malfunction. Both maps are produced and distributed by the Ministry of Environment and are used in disaster management policy, including disaster risk area designation, disaster prevention facility planning, and early warning system development.
A flood trace map is spatial data recording the extent and depth of flood damage from typhoons or heavy rainfall based on field surveys and measurements. In accordance with the Natural Disaster Countermeasures Act, local government heads prepare it within six months of the damage, and it is provided by the Ministry of the Interior and Safety. The map includes information on flood extent, depth, and duration, and is used to identify frequently flooded areas, designate disaster risk zones, establish recovery plans, and determine priorities for installing disaster prevention facilities.
1 / 4
City/County Flood Risk Index Ranking
경기도 홍수위험도 세부지표(2023년 기준)
선택할 수 있는 데이터
Flood Risk Grade and Area Proportion by Grid Unit per City/County
Living population exposed to flood risk
Gyeonggi-do
경기도 Living population exposed to flood risk statistics
선택할 수 있는 데이터
Flood Vulnerable Facilities
홍수위험도 지수
홍수위험도 지수 설명
확률강우량 지수
확률강우량 지수는 1에 가까울수록 대상지역의 연도별 확률강우량(100년 빈도, 지속시간 24시간)이 크게 집계되었음을 의미합니다.
최대강우량 지수
최대강우량 지수는 1에 가까울수록 대상지역의 연도별 최대강우량(지속시간 24시간)이 크게 집계되었음을 의미합니다.
건축물수 지수
건축물수 지수가 1에 가까울수록 홍수위험에 노출된 건축물수가 많음을 의미합니다.
주민등록인구수 지수
주민등록인구수 지수는 1에 가까울수록 홍수위험에 노출된 주민등록인구수가 많음을 의미합니다.
공시지가 지수
공시지가 지수는 1에 가까울수록 홍수위험에 노출된 지역의 공시지가 합계(총액)가 더 큼을 의미합니다.
농경지 면적 지수
농경지 면적 지수는 1에 가까울수록 홍수위험에 노출된 농경지 면적이 넓음을 의미합니다.
노후건축물수 지수
노후건축물수 지수는 1에 가까울수록 사용 승인일 이후 20년 이상 경과된 홍수위험에 노출된 노후건축물수가 많음을 의미합니다.
의존인구수 지수
의존인구수 지수는 1에 가까울수록 홍수위험에 노출된 7세 이하, 65세 이상 인구수가 많음을 의미합니다.
밭·시설·인삼 재배면적 지수
밭·시설·인삼 재배면적 지수는 1에 가까울수록 홍수위험에 노출된 밭, 시설, 인삼 재배면적이 넓음을 의미합니다.
방재시설 밀도 지수
방재시설 밀도 지수는 1에 가까울수록 경기도 시군별 단위 면적당 수재해 관련 방재시설(하천, 유수지, 저수지, 방수설비, 사방설비, 방조설비) 수의 밀도가 낮음을 의미합니다.
누적 방재예산액 비율 지수
누적 방재예산액 지수는 1에 가까울수록 경기도 시군별로 투입한 단위 면적당 방재예산(025 재난방재민방위 예산, 141 수자원 예산) 비율이 낮음을 의미합니다.
Landslide
Landslides are one of the most unpredictable natural disasters, causing fatal damage to lives and property. In particular, the increase in extreme rainfall and wildfires due to climate change is further increasing the risk of landslides.
Our platform collected and analyzed data on 1,316 landslides that actually occurred in Gyeonggi-do over the past 6 years (2018-2023) to accurately reflect local landslide characteristics. These extensive real-world cases were combined with AI technology to classify landslide risk areas.
In the evaluation process, various environmental factors such as topography, soil characteristics, and vegetation distribution (slope, slope curvature, terrain wetness index (TWI), soil depth, forest type, density, etc.) were comprehensively considered. In particular, we aimed to reflect realistic terrain characteristics through aerial LiDAR surveying in 2024. Through this process, we precisely analyzed landslide risks across Gyeonggi-do and visualized the vulnerable areas.
This information provides practical safety insights to citizens and plays a key role in developing disaster prevention measures for local governments. In particular, disaster management departments can use this information to efficiently conduct intensive monitoring and preventive maintenance in high-risk areas.
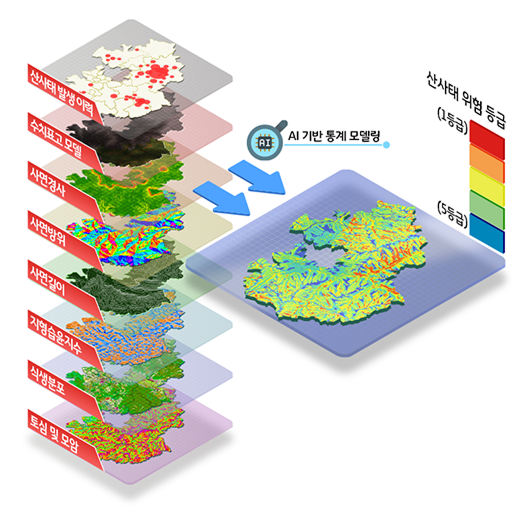
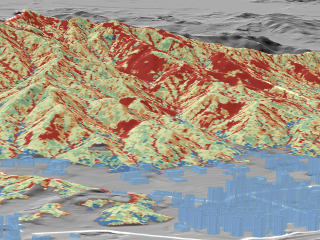
The Gyeonggi-do landslide risk level map is spatial data constructed at 10m resolution, developed using AI prediction models such as XGBoost, based on LiDAR topographic data and landslide history records. Using major factors such as slope gradient and soil depth, landslide risk is visualized in five levels, providing a scientific basis for disaster prevention and safety policy development.
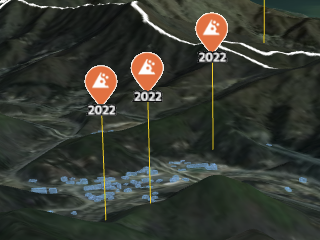
The Gyeonggi-do landslide occurrence history dataset is based on the landslide disaster register from 2018 to 2024, and includes information such as the time and location of each landslide in the province. This dataset serves as a key foundation for various administrative and scientific purposes, such as monitoring landslide risk areas and developing disaster prevention policies.
1 / 4
Local Weather Information
Provides real-time, accurate local weather information and weather alerts.
기상청 500m 고해상도 기상정보를 활용하여 정밀한 기상정보를 제공합니다.
기상청 500m 고해상도 기상정보를 활용하여 정밀한 기상정보를 제공합니다.
- 체감
- -˚
- 습도
- -%
- 풍향
- -m/s
기상특보
발령정보
통합대기환경지수 - (-)
Air Quality Information at Monitoring Stations
내 위치에서 가까운 측정소가 조회되면 차트가 표시됩니다.
This graph is based on real-time air quality information.
More information is available from the Gyeonggi-do Air Quality Information Service.
More information is available from the Gyeonggi-do Air Quality Information Service.
