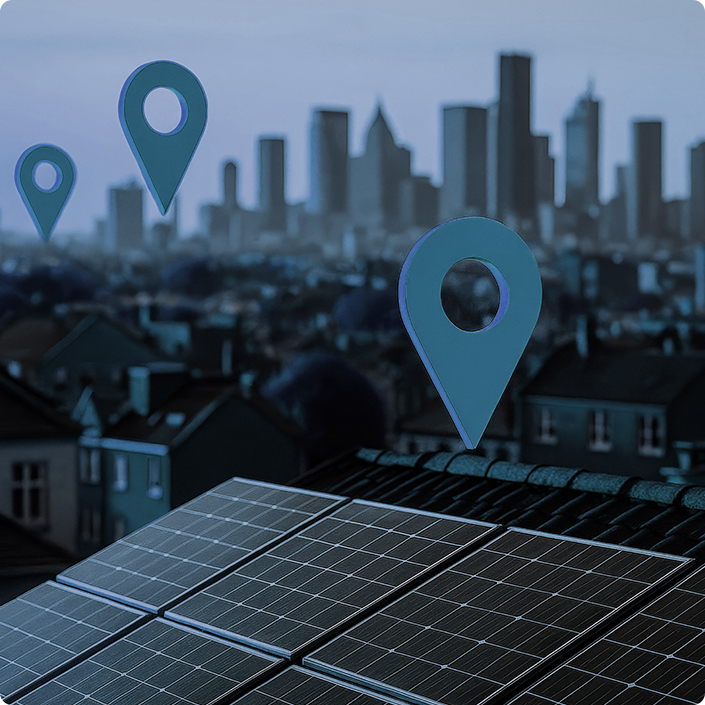
Introduction of Solar Power
Check solar power potential and installation status across Gyeonggi-do, along with simulations of the effects of introducing solar power facilities.
Solar power has the advantage of being the easiest renewable energy to implement.
However, simply installing solar panels does not guarantee high-efficiency energy generation. Selecting an optimal site based on solar potential and terrain shading is crucial.
The solar power introduction service provides information on solar potential and facility status across Gyeonggi-do. Additionally, optimal installation sites for buildings or terrain can be identified through simulation.
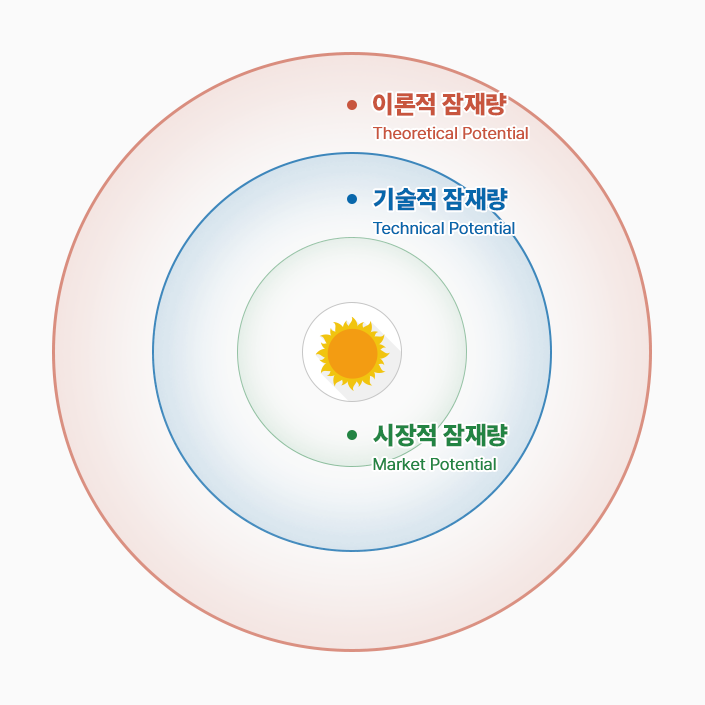
태양광 잠재량
Theoretical Potential
Capacity
0
GWTechnical Potential
Capacity
0
GWMarket Potential
Capacity
0
GWTheoretical Potential
Generation
0
GWhTechnical Potential
Generation
0
GWhMarket Potential
Generation
0
GWhTheoretical Potential
Maximum energy potentially usable, calculated based on solar radiation reaching the entire Gyeonggi-do region.
Calculated solely from solar radiation data, without considering technical, geographic, policy, or economic constraints.
This represents the basic stage in assessing solar power potential.
Technical Potential
The amount of energy technically usable, calculated from theoretical potential and reflecting technical and geographic constraints such as module efficiency, available area, and terrain conditions.
이론 잠재량에 비해 현실성을 갖춘 수치로, 기술적 가능성을 평가하는 데 중요한 지표입니다.
Market Potential
Practically usable energy, calculated from technical potential while considering policy and economic constraints.
Excluding areas restricted by regulations, it evaluates economic feasibility based on generation cost and selling price, providing realistic benchmarks for investors and operators.
(Data) Using total solar radiation on the horizontal surface of Cheollian 1 (average from 2012 to 2019) provided by the Korea Energy Research Institute.
(Resolution) Original grid data has a 1,500 m resolution and is converted to 10 m resolution using inverse distance weighted interpolation. Grid size is 100 m², unit: MWh/year.
(Solar power type) Rooftop solar assumed for grids containing buildings, and ground-mounted solar assumed for grids without buildings.
(Geographic restrictions) Excludes areas with mountains, rivers, landslide grade 1 zones, slopes ≥15°, and elevations ≥1,000 m.
(Technical constraints) Since solar modules convert only a portion of incident solar radiation into electricity, technical constraints are reflected by module area and efficiency.
(Policy restrictions) Areas where solar installation is prohibited due to land use, cultural heritage, non-development zones, ecological level 1, or other protected areas are excluded from potential calculations.
(Economic constraints) Areas where the levelized cost of electricity (LCOE) of solar power exceeds the sum of the system marginal price (SMP) and the weighted renewable energy certificate price are excluded as economically infeasible.
1 / 5
Status of Solar Power Potential in Gyeonggi-do
Multifaceted solar power potential statistics for Gyeonggi-do and its 31 cities and counties can be clearly understood through cartograms and interactive graphs.
선택지역정보
Gyeonggi-do
경기도 내의 Theoretical Potential 비율
%
경기도 내의 Theoretical Potential 순위
/31위
Legend [Unit GWh]
Card Graph View
경기도 Solar Power Potential
Gyeonggi-do
경기도 Solar Power Potential 통계
선택할 수 있는 데이터
Table View
경기도 Solar Power Potential
Solar Power Potential Data (KWh)
| 선택 문구 |
|---|
| 선택된 시군/읍면동 또는 데이터가 없습니다. 시군/읍면동 또는 데이터를 선택하여 주십시오. |
Solar Power Facility Status
Gyeonggi-do Solar Power Installation Area
Total
11346011
m²Installed Capacity
Total
2602
MWAnnual Power Generation
Total
3419417
MWhGyeonggi-do Solar Power Installation Area
Building Type
8228005
m²Installed Capacity
Building Type
1887
MWAnnual Power Generation
Building Type
2479724
MWhGyeonggi-do Solar Power Installation Area
Ground Type
3118006
m²Installed Capacity
Ground Type
715
MWAnnual Power Generation
Ground Type
939693
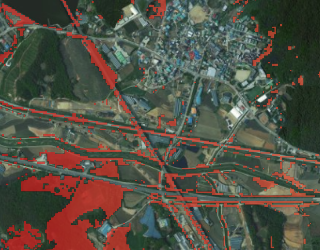
MWhAI Technology Provides Status Information on Solar Power Facilities Throughout Gyeonggi-do
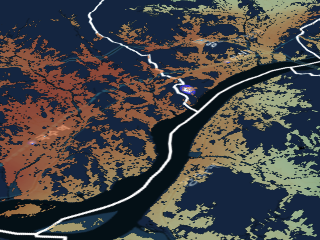
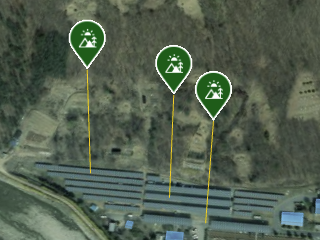
The status of solar power facilities was surveyed across Gyeonggi-do, excluding border areas, using a 25 cm resolution video map produced from aerial photos taken in 2023 by the National Geographic Information Institute.
The current status of solar power facilities was accurately detected using AI video analysis technology, including panels installed on building rooftops, industrial complexes, single-family homes, commercial buildings, and parking lots.
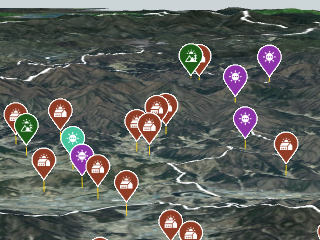
Status information is provided by distinguishing between installations within buildings and those on the ground.
Installations within buildings are classified as private homes, apartment complexes, industrial complexes, logistics warehouses, and public facilities, while ground installations are categorized as farmland, mountainous areas, and water surfaces for easy reference.
If an application or registration for installation was made but the facility does not appear on the 2023 National Geographic Information Institute video map, it is classified as a scheduled installation site.
Therefore, facilities installed after 2023 are reported as scheduled installations, even if they have already been physically installed.
The location and installation area of solar power facilities were analyzed using AI detection technology based on the 2024 orthoimagery produced by the National Geographic Information Institute. Based on this, expected power generation for each facility can be estimated using solar radiation data from the Korea Meteorological Administration.
Data 02
Solar Power Generation Facility (Building Installation Type)
OPEN & Share 바로가기
Go to Climate Map
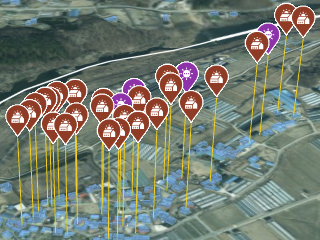
건Provides the status of solar power facilities installed on building rooftops. Installation status on rooftops throughout Gyeonggi-do, including private homes, industrial complexes, warehouses, apartment complexes, and public facilities, can be easily viewed on the map.
Data 03
Solar Power Generation Facility (Ground Installation Type)
OPEN & Share 바로가기
Go to Climate Map
Provides location information for solar power facilities installed on surfaces other than rooftops, such as farmland, mountainous areas, and water surfaces.
1 / 1
Gyeonggi-do Solar Power Facility Status
Multifaceted solar power facility status in Gyeonggi-do and its 31 cities and counties can be clearly understood through cartograms and interactive graphs.
선택지역정보
Gyeonggi-do
경기도 내 의 Total Power Generation Status 비율
%
경기도 내 의 Total Power Generation Status 순위
/31위
Legend [Unit MWh]
Card Graph View
Solar Power Facility Status
Gyeonggi-do
경기도 Solar Power Facility Status 통계
선택할 수 있는 데이터
Table View
Solar Power Facility Status
Solar Power Facility Status Data
| 선택 문구 |
|---|
| 선택된 시군/읍면동 또는 데이터가 없습니다. 시군/읍면동 또는 데이터를 선택하여 주십시오. |
What is a Solar Energy Introduction Analysis Simulation?
This service provides detailed analysis of suitable locations for solar power installations on building rooftops and ground, expected power generation, and projected revenue across all areas of Gyeonggi-do, excluding border regions.
Analysis of Suitable Locations for Solar Power Facilities on Building Rooftops and Ground
The location and area of solar power facilities are precisely calculated using detailed shading information that considers surrounding high-rise buildings, terrain, and other environmental factors.
The service provides optimal locations and the number of panels, offering user-centered functionality to easily adjust panel quantity.
Provides Solar Installation Benefit-Cost and Regulatory Review Information
Based on the selected or adjusted number of optimal solar panels, a benefit analysis is provided using installation costs and expected power generation. In addition, various regulatory information for solar power plant installation is simultaneously available via interactive maps.
Go to Simulation 시뮬레이션은 현재 PC 환경에서만 지원됩니다.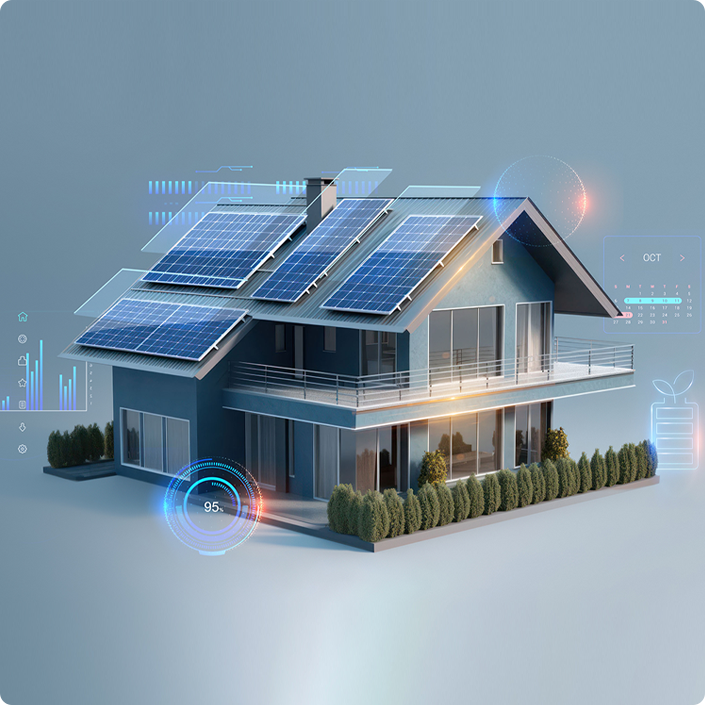
Solar Energy Introduction Analysis Simulation – Main Process
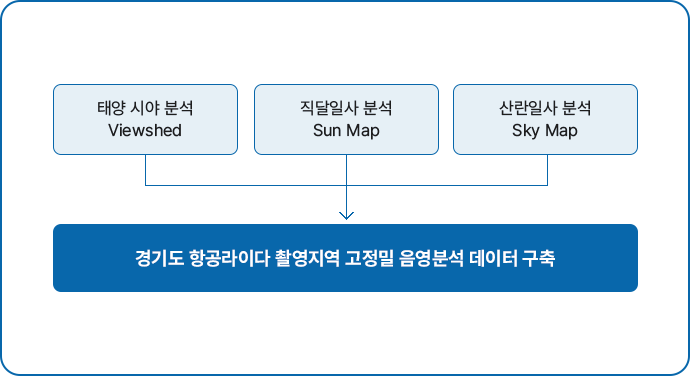
The simulation utilizes high-precision aerial lidar data from Gyeonggi-do, solar radiation data from the Korea Meteorological Administration, and energy data from the Real Estate Agency. Using these datasets, Esris solar radiation analysis solution was applied to generate shading data for building rooftops and terrain parcels. Based on these data, an installation analysis simulation for solar energy introduction was implemented.
01 활용데이터
그린리모델링 분석 요청
- 항공라이다 데이터
- 일사량 데이터
- 건축물 에너지사용량
02 음영분석
 ArcGIS® Solar RadiationArcGIS® Solar Radiation
03 도입분석
시뮬레이션
- 태양광 설치 적지지역 분석
- 태양광 효율기반 시뮬레이션
- 최적 패널 수 분석
- 예측발전량 분석
- 발전사업 예상분석
- 태양광 설치 규제지역
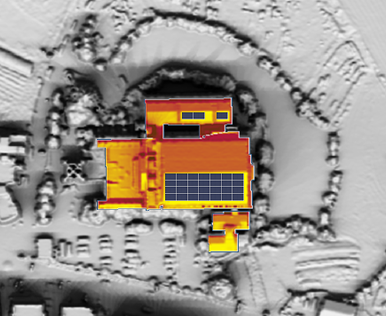
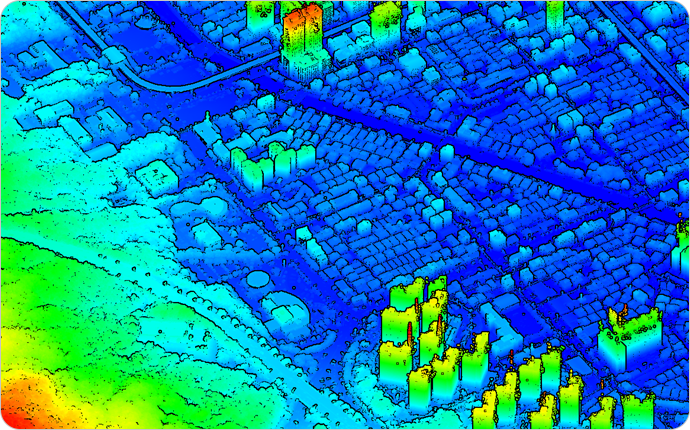
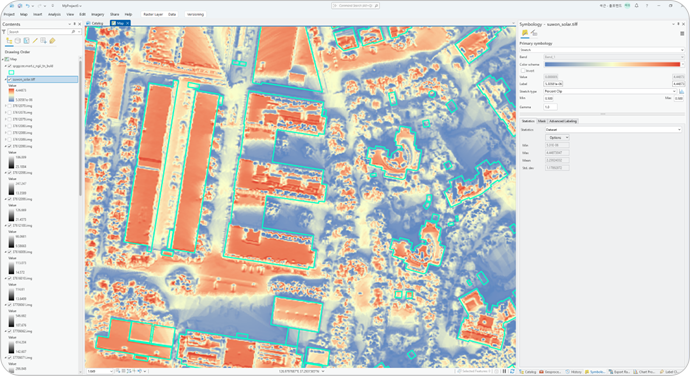
Utilize High-Precision Aerial Lidar Data
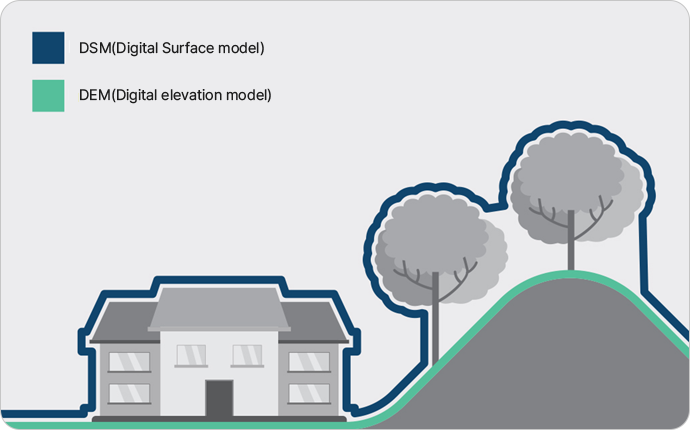
Ultra-high precision DSM and DEM with 0.5 m grids were generated using aerial lidar data captured in Gyeonggi-do. These high-precision data accurately represent real-world terrain and facilities, providing a foundation for precise shading analysis caused by buildings, facilities, and terrain.
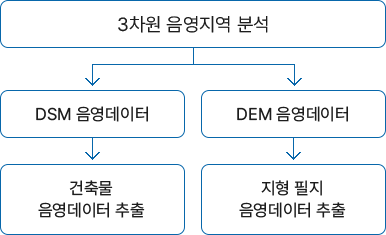
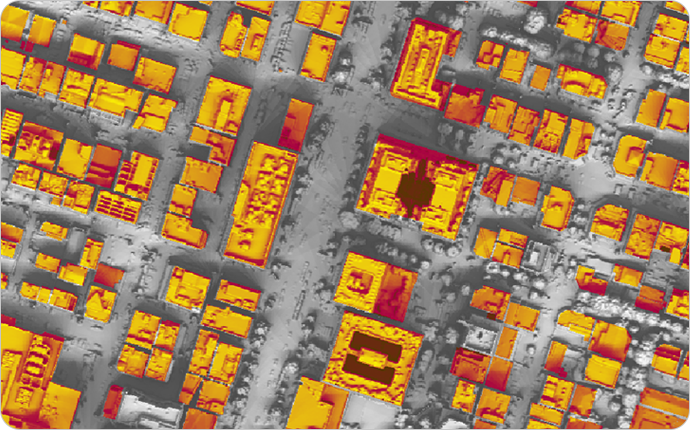
Construction of Precise DSM-Based Shading Data for 1.56 Million Building Rooftops in Gyeonggi-do
Precise 0.5 m grid DSM data, accounting for surrounding high-rise buildings and terrain, were produced for approximately 1.56 million buildings throughout Gyeonggi-do, excluding border regions. Data were constructed to comprehensively analyze sunlight and shading conditions on rooftops for all building types, including single-family homes, apartments, industrial buildings, and public facilities.
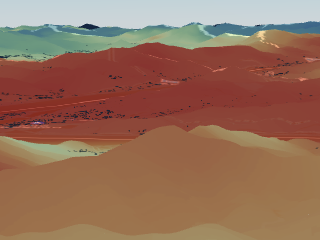
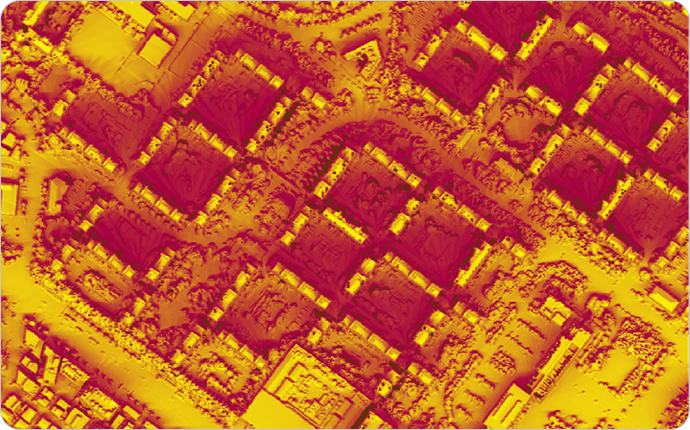
Topographic Parcel Shading Data
Solar radiation on building rooftops is influenced by surrounding buildings and terrain. High-precision shading data is also necessary to maximize solar facility installations in limited areas. However, for terrain parcels, using DSM alone may yield inaccurate simulations due to unreflected objects such as street trees. However, for terrain parcels, using DSM alone may yield inaccurate simulations due to unreflected objects such as street trees.
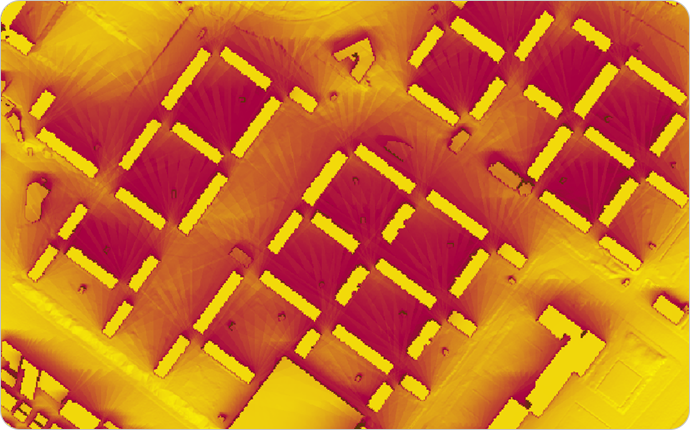
Shading Data Construction Using Global Solutions
Using precise DSM and building DEM, Esris ArcGIS Solar Radiation Tool was applied to construct shading data for building rooftops and terrain parcels.
Shading data was produced using annual solar radiation information.
Standard for Automatic Solar Panel Placement and Installation
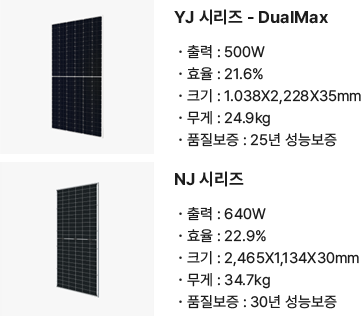
Optimal solar panel installation sites are automatically analyzed using shading data generated from high-precision aerial lidar-based DSM and building DEM. Users can select the latest solar panel modules and installation angles, with results prioritized for optimal locations. Users can adjust the number of panels and check power generation and estimated costs according to panel quantity and installation location.
01 패널모듈 설계
최신 태양광 패널 모듈 설계 반영
(패널크기, 용량 등)
02 모듈 이격거리 산정
태양광 패널 최적의 설치조건
자동 반영
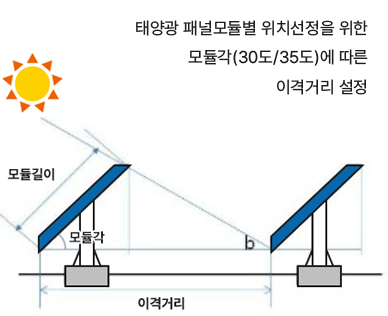
03 정밀 모듈 배치
음영분석 데이터 활용
일사량 우수 패널적지 우선선정