Green infrastructure status

Key information for nature-based solutions

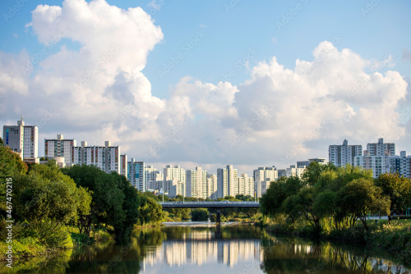
Green infrastructure includes parks, forests, wetlands, urban green spaces, and rivers. It provides mitigation functions by reducing greenhouse gases through carbon absorption, and also offers adaptive functions that enhance urban resilience to extreme weather events such as heat waves, floods, and droughts. In the era of climate crisis, it is crucial to strategically plan and manage green infrastructure, which provides environmental, social, and economic benefits by utilizing the functions of nature. The quantitative and qualitative status of all urban parks in Gyeonggi-do has been evaluated from multiple perspectives and organized into spatial information. In addition, ecosystem services of Gyeonggi-do’s natural environment in terms of supply, regulation, culture, and support have been evaluated. Their value was analyzed in monetary terms to build information that enhances the understanding of both citizens and policy makers. This information provides a scientific basis for establishing climate change response policies, setting priorities for green infrastructure investments, identifying vulnerable areas, and developing urban plans. In particular, it serves as an educational tool to raise awareness of environmental values among citizens.

Ecosystem service evaluation

Gyeonggi-do-wide ecosystem service value (annual)

59,138.5 billion

59138469

million KRW

Annual ecosystem service benefits per person

4,057,000 KRW

4056915

KRW

Monetary value of supply services (annual)

15,573.3 billion

15573336

million KRW

Monetary value of regulation services (annual)

9,375.5 billion

9375544

million KRW

Monetary value of cultural services (annual)

34.895 billion won

34189589

million KRW

Ecosystem service valuation
A new standard for responding to the climate crisis

Ecosystem services refer to the various benefits that humans receive from ecosystems. Gyeonggi-dos abundant forests, rivers, wetlands, and agricultural lands go beyond scenery and serve as key infrastructure that protects us in the era of climate crisis.

Ecosystem service assessment is an essential step in responding to the climate crisis. Forests and wetlands absorb and store carbon from the atmosphere, while urban forests and parks mitigate the urban heat island effect during hot summers. They also reduce disasters such as floods and droughts, enabling safer lives. Nature provides beautiful scenery and resting spaces, offering urban residents leisure opportunities and positively impacting physical and mental health. To continuously enjoy these benefits, a healthy ecosystem—meaning the conservation of biodiversity—is essential.

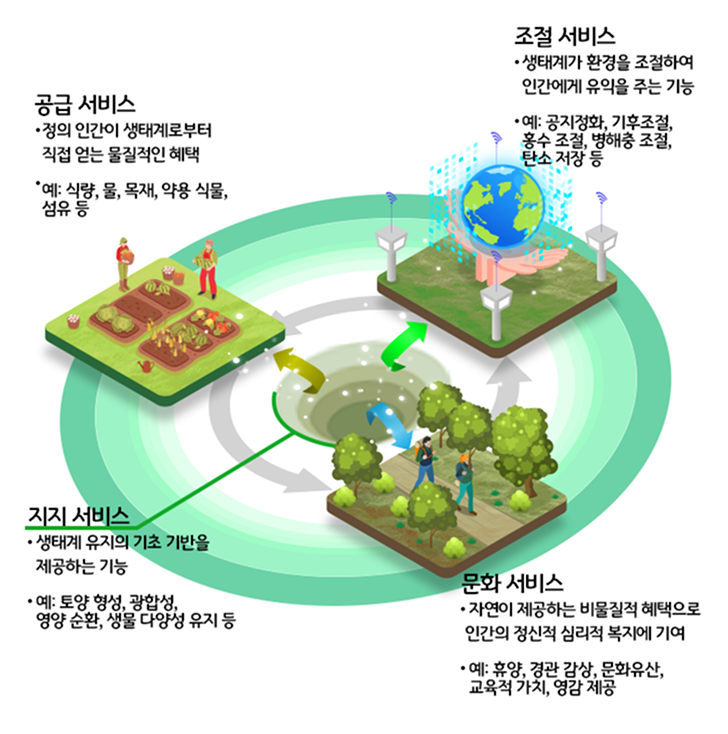
Gyeonggi-do’s ecosystem service evaluation categorized these natural benefits into supply, regulation, cultural, and supporting services, and calculated their value in monetary terms. Ecosystem service valuation provides scientific standards that support the coexistence of economic development and environmental conservation without conflict. In particular, it highlights climate crisis response functions such as carbon absorption, air purification, and climate regulation. The evaluation results serve as a scientific basis for formulating climate crisis response policies. They can be applied to forest conservation and expansion for carbon neutrality, green infrastructure investments to mitigate urban heat islands, and the introduction of nature-based solutions for climate change adaptation.
생태계서비스 이미지
생태계서비스 스코어

Ecosystem service valuation was conducted to calculate the unit value of each ecosystem service for various biotope types in the urban ecosystem. To this end, Korea Environmental Research Institutes EVIS and ESPs ESVD databases were used to meta-analyze valuation results for domestic and international ecosystem types and services. Domestic standards (Ministry of Land, Korea Forest Service, Ministry of Agriculture, Food and Rural Affairs) and international cases (Germany, Australia, USA, France) were reviewed to derive appropriate environmental resource values. Based on these results, unit value metrics for each ecosystem service were presented and validated through expert consultation to ensure practical application in urban ecological policies.

공급 서비스

The water supply service provided by the ecosystem to humans was evaluated, focusing on baseflow, which is essential for river maintenance. By spatially quantifying and evaluating the relative contribution of baseflow, which slowly infiltrates soil and supplies rivers over time, the ecosystem function that ensures stable water supply even during dry periods was clarified.

조절 서비스

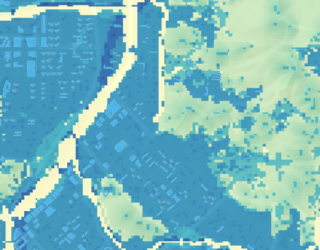
The ability of ecosystems to mitigate and regulate negative impacts on humans and the environment was assessed. Evaluation items included water purification (nutrient control), air pollutant absorption and removal, carbon absorption and storage for climate regulation, urban heat island mitigation, and soil erosion prevention, quantifying the ecosystem’s environmental regulation capacity.

문화 서비스

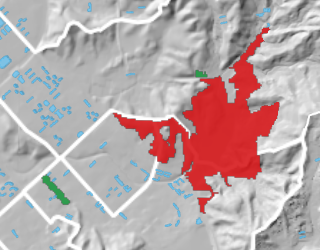
Recreational, leisure, and aesthetic values provided by the ecosystem to humans were evaluated. Focusing on major tourist resources and urban green spaces in Gyeonggi-do, the aesthetic value of natural landscapes and their usability for leisure and tourism were evaluated to analyze how the natural ecosystem contributes to cultural benefits and quality of life for residents.

지지 서비스

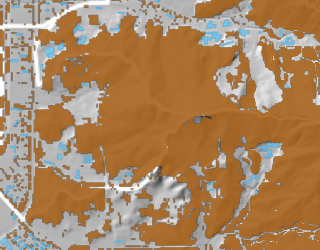
Biodiversity and habitat quality enabling the ecosystem to provide various ecosystem services were evaluated. Considering land use types and intensity in Gyeonggi-do, bird species diversity and habitat suitability were evaluated to quantitatively assess the environmental basis for biodiversity conservation, ensuring sustainable ecosystem functions.

1 / 5

Status of Ecosystem Services in Gyeonggi-do

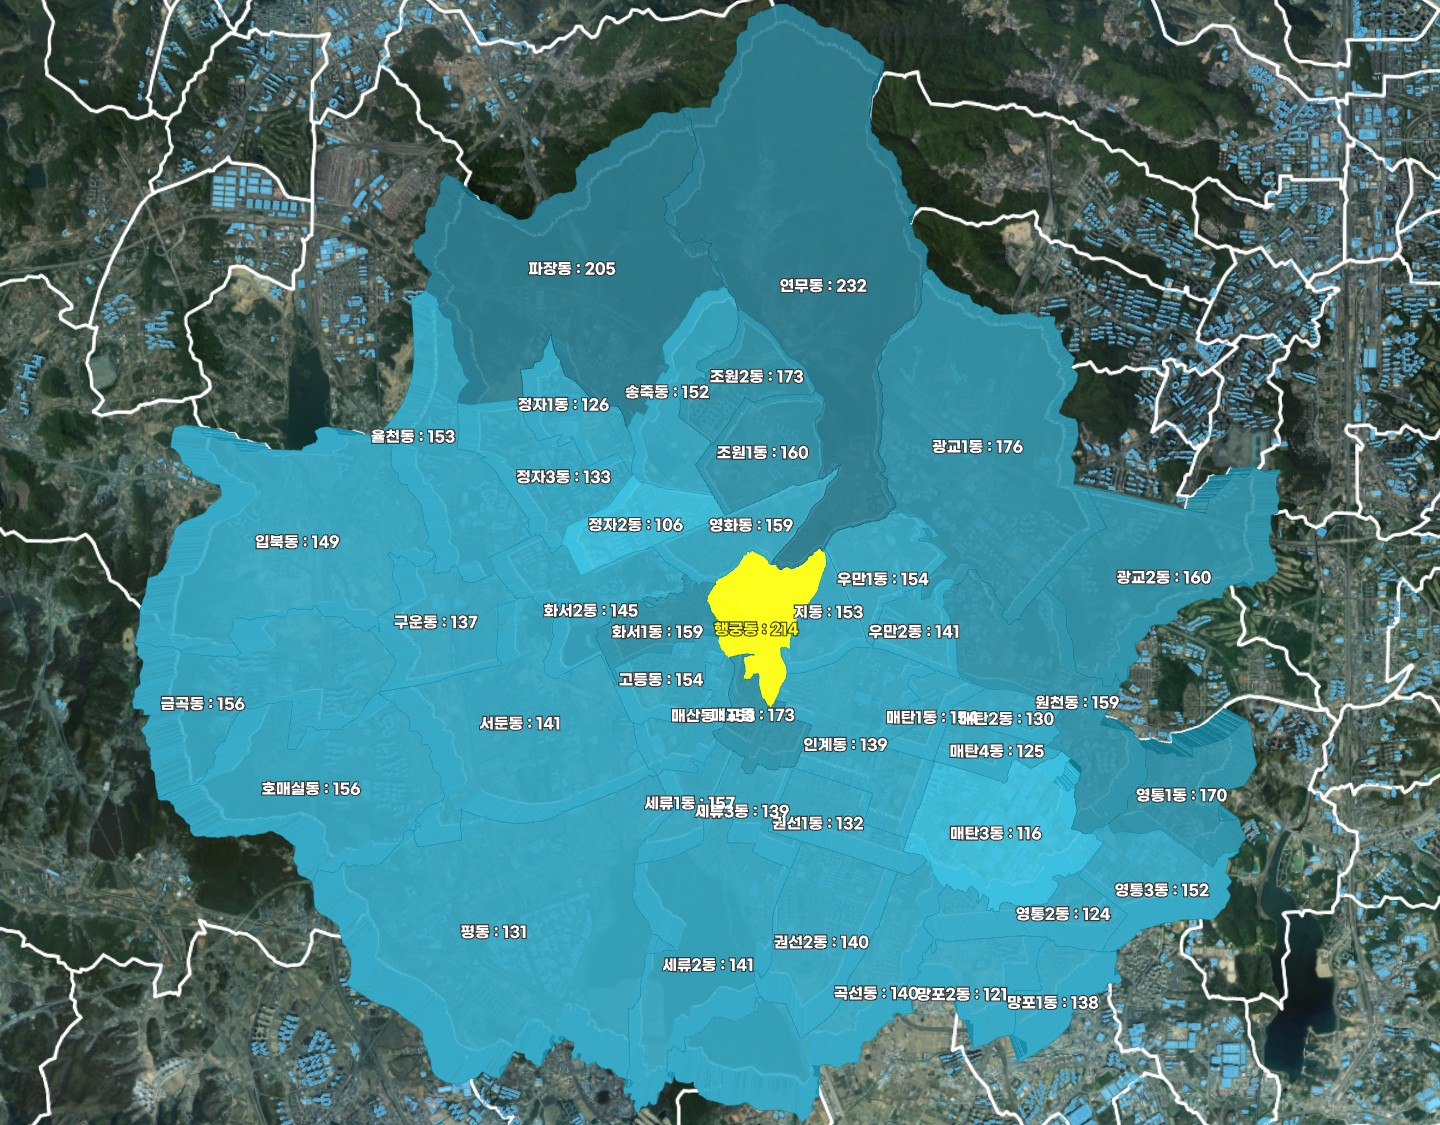
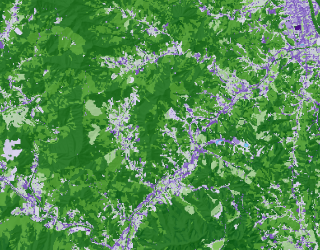
Ecosystem service values of Gyeonggi-do and its 31 cities and counties can be clearly understood through cartograms and interactive graphs.
선택지역정보

Gyeonggi-do

Ecosystem Services

million KRW

경기도 내 Ecosystem Services 비율

%

경기도 내 Ecosystem Services 순위

/31위

Legend (million KRW)

Card Graph View

Ecosystem Services

Gyeonggi-do

경기도 Ecosystem Services 통계

선택할 수 있는 데이터

    Table View

    Ecosystem Services

    Ecosystem Services Data

    Ecosystem Services Data
    선택 문구
    선택된 시군/읍면동 또는 데이터가 없습니다. 시군/읍면동 또는 데이터를 선택하여 주십시오.

    Urban Park Service Evaluation

    Number of Urban Parks in Gyeonggi-do

    Criteria for Completion of Construction

    4120

    Number

    Park Area per Person in Gyeonggi-do

    Based on Completion of Construction

    6.27

    Gyeonggi-do Park and Green Space Creation Budget

    2020-2024 Annual average for 5 years

    498

    KRW 100 Million

    Gyeonggi-do Park and Green Space Management Budget

    2020-2024 Annual average for 5 years

    1955

    KRW 100 Million

    Population Excluded from Park Services

    도보 5분 이내 공원 접근불가

    49.6

    %

    Annual Number of Park Users in Gyeonggi-do

    공원내 유동인구 기준(2024)

    203901252

    City Park Evaluation
    Urban Parks, Core Infrastructure in the Era of Climate Crisis

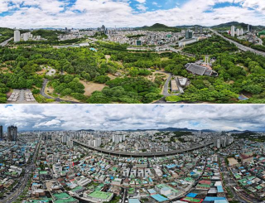
    In an era of climate crisis, urban parks are more than just green spaces; they are core urban infrastructure that mitigates the effects of climate change and strengthens the resilience of local communities. City parks are multifunctional spaces that can respond to increasingly severe climate risks such as heat waves, heavy rain, and air pollution, performing diverse roles in environmental, social, and economic aspects.

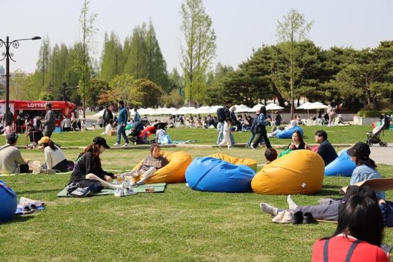
    First, urban parks alleviate the urban heat island effect through trees and vegetation, providing a more comfortable environment for populations vulnerable to heat waves. It also protects residents health by absorbing carbon and purifying the air, reducing disaster risks such as floods, and contributing to biodiversity maintenance. In addition, parks function as community spaces that enhance citizens psychological stability and community bonds, playing an important role in improving social resilience and quality of life.

    In this way, urban parks are ‘Green Infrastructure’ that is more than just green space; they are complex spaces that solve multi-layered challenges such as climate adaptation, carbon neutrality, health promotion, and social integration, and are essential resources for a sustainable city.

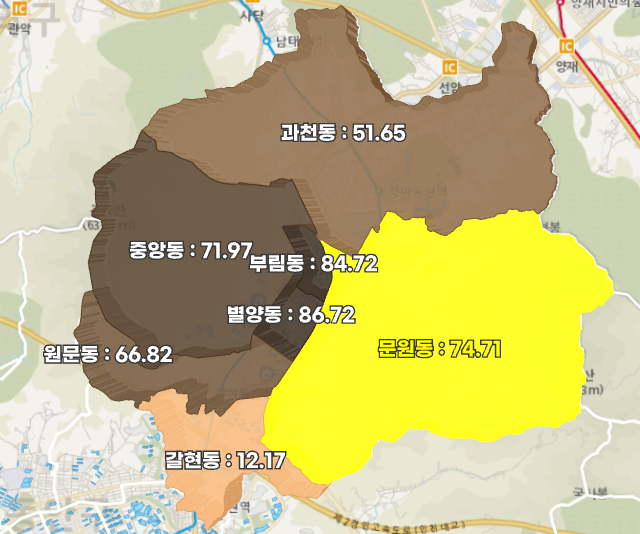
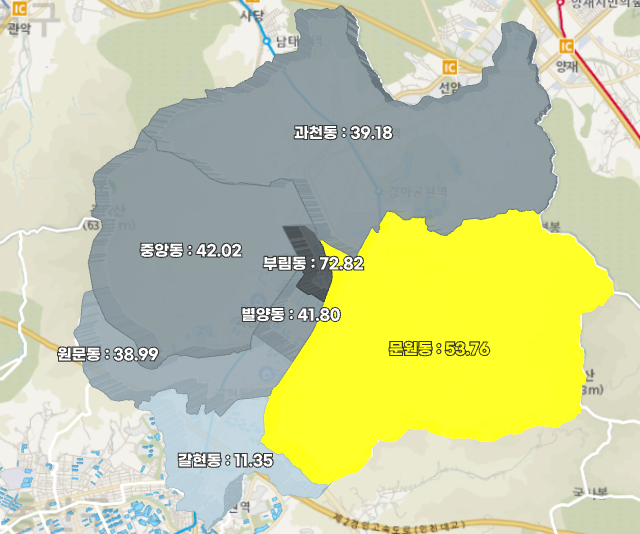
    The indicator developed to visualize the public value and climate response capacity of urban parks is ‘Our Neighborhood Park Score’. Park Score is a system that quantitatively evaluates the supply status of urban parks at the city, county, and administrative-dong level using multifaceted indicators, helping local governments improve park accessibility and quality and allocate budget more strategically. Ultimately, this serves as a policy basis for increasing social interest in urban parks, fostering a sustainable urban environment, and improving residents quality of life.

    Park Score is evaluated based on various indicators, standardized and synthesized at the city, county, and administrative-dong level to calculate a score. A higher Park Score indicates better urban park service level and climate crisis response capacity in the area.
    생태계서비스 이미지
    Data 01 Comprehensive Evaluation of Park Services
    OPEN & Share 바로가기 Go to Climate Map 데이터 작성방법
    공원 서비스 종합평가

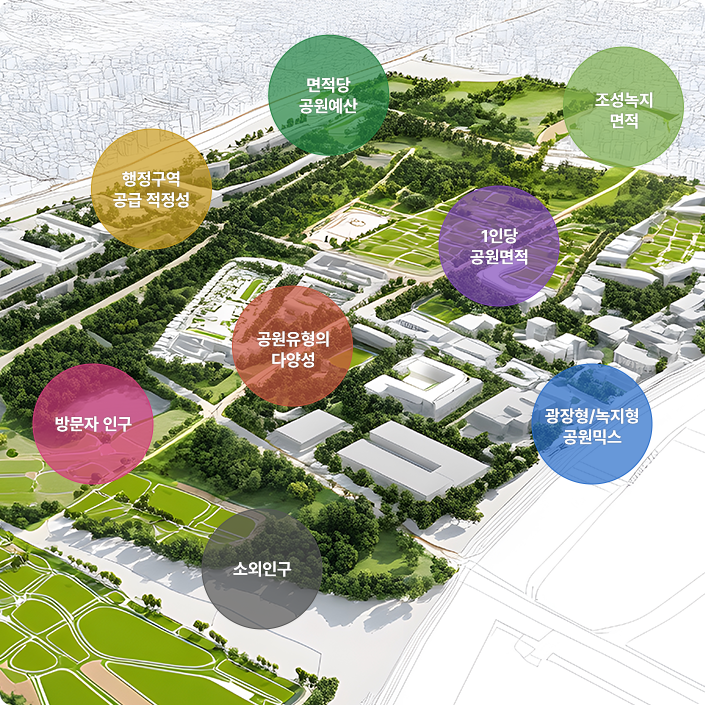
    The evaluation of urban park services comprehensively evaluates total park quantity, financial input, accessibility, design, and functional diversity in each region using detailed indicators such as park green area per capita, excess/undersupply per capita, average annual park management budget over 5 years, park visitor ratio, marginalized population ratio, park type diversity, plaza/green park mix, and developed green space ratio. The evaluation goes beyond simple area-focused analysis, considering both quality and equity of parks, providing a scientific basis for local government policy improvement, budget allocation, and sustainable urban planning.

    1인당 도시공원 면적

    Park green space per capita indicates the average amount of park green space accessible to each resident and is used to assess the quantity of park green space provided by region. This indicator is calculated by dividing the total park area by the population of the region, providing a measure to identify disparities in park resources and serving as a reference for park planning and policy formulation. Its adequacy can also be assessed against international or national recommended standards and serves as fundamental data to evaluate urban green space welfare and residents’ quality of life.

    Data 03 Supply Adequacy: Area Exceeding or Under 6㎡ per Person
    OPEN & Share 바로가기 Go to Climate Map 데이터 작성방법
    공급적정성: 1인당 6㎡ 초과/미달 면적

    The excess or shortage of park green space per person indicates how much green space an individual receives compared to the standard area (e.g., 6㎡ per person). This indicator quantifies regional variations in park green space supply and is used to assess whether park development goals are met and whether equity among regions is maintained. It also highlights areas with significant shortages that need priority improvement and serves as a basis for prioritizing park expansion in planning and policy design.

    Data 04 Management Budget Per Unit Area of the Park
    OPEN & Share 바로가기 Go to Climate Map 데이터 작성방법
    공원 단위면적당 관리 예산

    The management budget per unit area of the park measures the annual budget allocated per 1㎡ and reflects the park’s maintenance quality and financial investment effectiveness. It is used to assess whether the management budget is appropriate for the park area and to analyze differences in management quality among parks. If the management budget is insufficient, limitations may occur in facility maintenance, cleanliness, and vegetation management; this serves as a baseline to evaluate the minimum management input needed for a sustainable and pleasant park environment.

    공원 방문객 비율

    The annual park visitor ratio indicates the proportion of the population that actually visits the park within a year and assesses the actual usage and service effectiveness of the park. It is useful for measuring park resource utilization and identifying the need for improvements in underused parks or facility expansion in highly used parks. It also serves as important evidence for policy decisions regarding efficient budget allocation, park operation strategies, and improving residents’ quality of life.

    Data 06 Percentage of Population Excluded from Park Services
    OPEN & Share 바로가기 Go to Climate Map 데이터 작성방법
    공원 서비스 소외인구 비율

    The percentage of the population excluded from park services indicates those living more than a 5-minute walk from a park and unable to fully benefit from park services. It evaluates regional equity in park services based on spatial accessibility and identifies areas with poor access requiring policy intervention. Furthermore, it serves as a basis for planning park locations, prioritizing park expansion, and reducing disparities in environmental welfare and health.

    조성녹지 면적 비율

    The ratio of developed green space indicates the proportion of the total area that has been converted into road green space, environmental improvement green space, and facility-related green space. It is used to assess how developed green spaces can compensate for insufficient park green space in areas where park development is challenging. It serves as fundamental data to evaluate spatial equity in park services, explore alternative green space provision in deficient areas, and support urban green space planning and environmental welfare policies.

    공원 유형 다양성

    The diversity of accessible park types evaluates how many types of parks, such as small parks, childrens parks, neighborhood parks, and theme parks, can be accessed simultaneously. It is used to assess not only park accessibility but also functional and spatial diversity, and to analyze the options and quality of park services available to residents. It serves as a basis for evaluating the positive effects of access to diverse park types on residents’ leisure, health, and community engagement.

    공원 조성 다양성

    The mix of plaza-type and green-space parks assesses how balanced their design and functional provision are within a given area. It evaluates whether a park can simultaneously perform various social and ecological functions, including leisure, rest, exercise, and ecological roles, without bias toward a single function. The appropriate balance of plazas and green spaces enhances user choice and activity diversity and serves as a key criterion for ensuring park inclusiveness and sustainability.

    1 / 9
    Card Graph View

    Urban Park Evaluation

    Gyeonggi-do

    경기도 Urban Park 통계

    선택할 수 있는 데이터

      Table View

      Urban Park Evaluation

      Urban Park Data

      Urban Park Data
      선택 문구
      선택된 시군/읍면동 또는 데이터가 없습니다. 시군/읍면동 또는 데이터를 선택하여 주십시오.