Carbon Spatial Information
This map analyzes carbon sinks and emission sources, allowing you to see regional carbon balance and changes at a glance.
Intuitively visualize regional information by analyzing carbon sinks and emission sources in detail.
Users can view the carbon balance of a specific region on a map and see how it changes over time.
This data provides useful information to policy makers, researchers, and the general public alike, and contributes to developing effective carbon management strategies for a sustainable future.
Carbon Absorption (trees)
Annual carbon absorption
Gyeonggi-do entire (million tCO2eq/yr-1)
0
MtCO2eq/yr-1Carbon absorption by trees in forests
Natural forests planted forests, etc. (million tCO2eq/yr-1)
0
MtCO2eq/yr-1Carbon absorption by trees in established green spaces
Parks, street trees, apartment landscaping green spaces, etc. (million tCO2eq/yr-1)
0
MtCO2eq/yr-1Carbon absorption by trees in cultivated land
Rice fields, fields, orchards, etc. (million tCO2eq/yr-1)
0
MtCO2eq/yr-1Vegetation carbon absorption in rivers and lakes
Reservoirs, embankment slopes, etc. (million tCO2eq/yr-1)
0
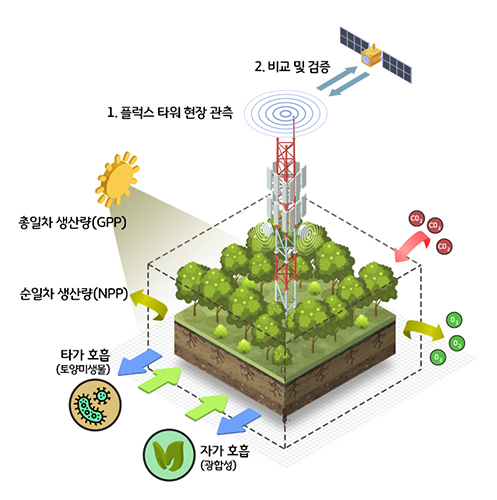
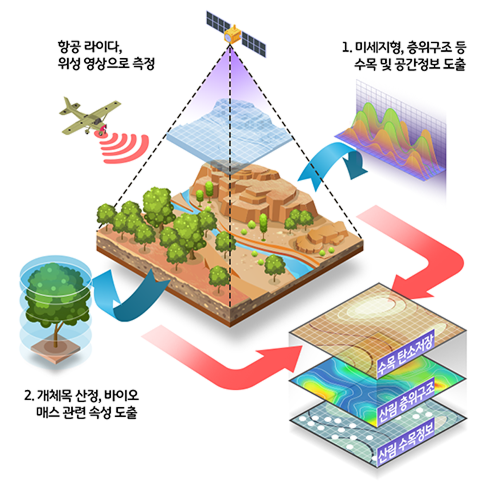
MtCO2eq/yr-1Climate Change Response Solution Based on High-Precision Carbon Sink Map with Satellite Images and BESS Model
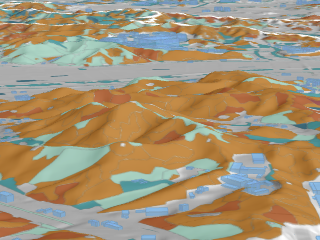
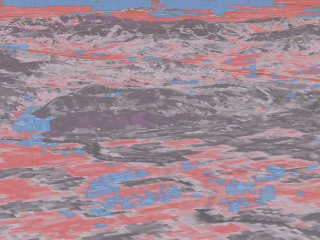
The Gyeonggi-do carbon sink map is a precise spatial information service built at 10m high resolution to scientifically visualize the carbon absorption capacity of the local ecosystem. This map was developed through the integrated application of satellite image analysis, flux tower ground truth data, and the Biophysical Extrapolation System (BESS) model.
The map displays the carbon absorption of various ecosystems such as forests, agricultural lands, wetlands, and urban green spaces in Gyeonggi-do, classified by color. The mechanism-centered approach using the BESS model precisely models tree photosynthesis and ecosystem respiration, reflecting changes in carbon absorption according to seasonal changes and environmental conditions.
Carbon absorption was calculated based on vegetation index, leaf area index, land cover information, and meteorological data extracted from satellite images, and verified with Flux Tower data.
This map can be used in decision-making on climate change response policies, urban planning, and forest management, and serves as an educational tool for citizens to understand the current status of local carbon absorption. Through the climate platform, users can interactively explore carbon absorption information across Gyeonggi-do and check trends over time.
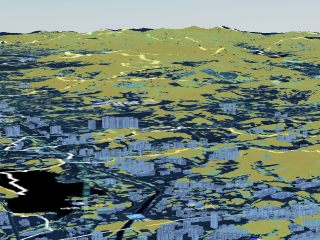
The Gyeonggi-do carbon sink map is precise spatial information constructed at 10m resolution and was developed by applying the BESS model based on satellite images and ground truth data. It visualizes the carbon absorption of various ecosystems such as forests and agricultural lands, and provides important scientific basis for responding to climate change and establishing environmental policies.
Total primary production refers to the total amount of carbon fixed from the atmosphere to the terrestrial ecosystem through photosynthesis in the corresponding ecosystem. Through total primary production, we can identify different amounts of carbon absorption by ecosystem.
The leaf area index is an index that represents the area of leaves per unit area. This index plays a key role in calculating total primary production.
Data 04
Solar Radiation
데이터 작성방법
Solar radiation is an essential element in plant photosynthesis. Solar radiation usually contains a lot of low-resolution data, but this was calculated at high resolution by taking terrain effects into account.
1 / 5
Gyeonggi-do Carbon Absorption Status
You can clearly understand the multifaceted carbon absorption statistics of Gyeonggi-do and 31 cities and counties with cartograms and responsive graphs.
선택지역정보
Gyeonggi-do
경기도 내 의 Carbon Absorption 비율
%
경기도 내 의 Carbon Absorption 순위
/31위
Legend [Unit 천tC/yr⁻¹]
Card Graph View
Carbon Absorption (trees)
Gyeonggi-do
경기도 Carbon Absorption 통계
선택할 수 있는 데이터
Table View
Carbon Absorption (trees)
Carbon Absorption Data (kgC/yr⁻¹)
| 선택 문구 |
|---|
| 선택된 시군/읍면동 또는 데이터가 없습니다. 시군/읍면동 또는 데이터를 선택하여 주십시오. |
Carbon storage (Trees)
Total carbon storage of trees
Entire Gyeonggi-do (million tCO2eq)
0
MtCO2eqCarbon storage of trees in forests
Natural forests, planted forests, etc. (million tCO2eq)
0
MtCO2eqCarbon storage of trees in established green space
Parks, street trees, apartment landscaping green spaces, etc. (million tCO2eq)
0
MtCO2eqCarbon storage of trees in cultivated land
Rice fields, fields, orchards, etc. (million tCO2eq)
0
MtCO2eqVegetation carbon storage in rivers and lakes
Reservoirs, embankment slopes, etc. (million tCO2eq)
0
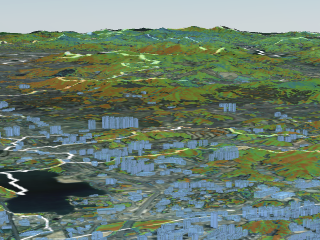
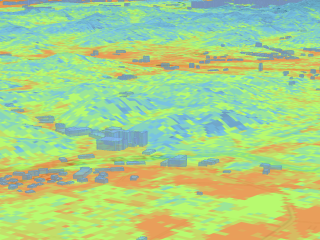
MtCO2eqClimate Change Response Solution Based on High-Precision Vegetation Carbon Map Constructed with 3D LiDAR and Satellite Data
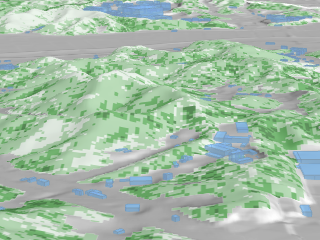
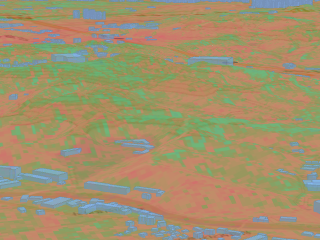
The Gyeonggi-do Tree Carbon Map is a precise spatial information service built based on 3D information, and is a scientific visualization of the carbon storage capacity of trees in each region.
This map was created based on calculating biomass by tree species and individual trees using aerial point cloud data and high-resolution satellite images.
The map displays the carbon storage of various urban vegetation such as forests, park green spaces, and street trees in Gyeonggi-do, classified by color.
By acquiring tree information, including individual tree height, based on remote sensing data and applying relative growth equations for each tree species, we accurately reflected the actual scale of trees in forests and urban green spaces in Gyeonggi-do and calculated accurate carbon storage.
Most areas were created based on aerial LiDAR data, and border areas were based on high-resolution satellite images, and tree species information based on field surveys was reflected.
This map can be used for various decision-making, such as establishing Gyeonggi-dos climate change response policy, urban planning considering landscape and environmental factors, and forest management. It also guides citizens to recognize the current status of local vegetation carbon storage.
The Gyeonggi-do tree carbon storage map is precise spatial information constructed as the smallest unit of the urban ecological status map, and was developed through a calculation method at the individual tree level based on aerial LiDAR and high-resolution satellite image data. By visualizing the carbon storage of various vegetation such as forests and parks, we provide basic data for realizing carbon neutrality in Gyeonggi-do.
Forest stratigraphic maps are based on vegetation height measured with 3D aerial LiDAR. The layer structure analysis was made based on the absolute height range of each of the four predefined layers, and the number of layers was analyzed flexibly according to the vegetation environment of the analysis target area. Stratigraphic structure maps are used to evaluate the degree and complexity of vertical development of forests by providing precise stratigraphic structure information at a regional level through remote sensing and to establish forest management policies related to forest health and biodiversity.
The Forest Tree Information Map provides data on average tree height, population, and canopy coverage across the forests of Gyeonggi-do, based on three-dimensional vegetation information. Detailed vegetation information throughout the forests of Gyeonggi-do, calculated through entity-level analysis of 3D point cloud data, can be used as scientific data for habitat analysis within forests, biodiversity assessment, and forest management and restoration policy establishment.
1 / 5
Status of carbon storage of trees in Gyeonggi-do
You can clearly understand the multifaceted tree carbon storage statistics of Gyeonggi-do and 31 cities and counties with cartograms and responsive graphs.
선택지역정보
Gyeonggi-do
경기도 내의 Carbon storage (Trees) 비율
%
경기도 내의 Carbon storage (Trees) 순위
/31위
Legend [Unit 천tC]
Card Graph View
Carbon storage (Trees)
Gyeonggi-do
경기도 Carbon storage (Trees) 통계
선택할 수 있는 데이터
Table View
Carbon storage (Trees)
Carbon storage (Trees) Data (kgC)
| 선택 문구 |
|---|
| 선택된 시군/읍면동 또는 데이터가 없습니다. 시군/읍면동 또는 데이터를 선택하여 주십시오. |
Carbon Storage (Soil)
Total Soil Carbon Storage
Entire Gyeonggi-do (million tCO2eq)
0
MtCO2eqSoil Carbon Storage in Forests
Natural forests, planted forests, etc. (million tCO2eq)
0
MtCO2eq/㎢Soil Carbon Storage in Established Green Space
Parks, street trees, apartment landscaping green spaces, etc. (million tCO2eq)
0
MtCO2eqSoil Carbon Storage in Cultivated Land
Rice fields, fields, orchards, etc. (million tCO2eq)
0
MtCO2eqSoil Carbon Storage in Rivers and Lakes
Reservoirs, embankment slopes, etc. (million tCO2eq)
0
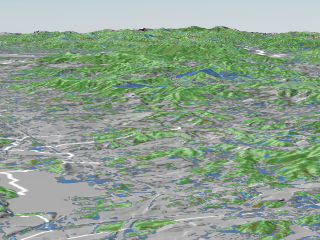
MtCO2eqHigh-Precision Carbon Thematic Map Based on Soil Measurements and Machine Learning at 1,500 Locations Across Gyeonggi-do, Implemented as a Spatial Solution to Respond to Climate Change
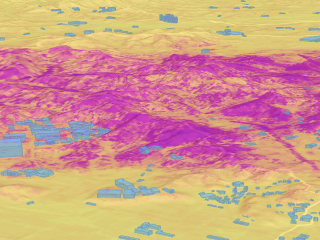
The Gyeonggi-do Soil Carbon Thematic Map is a precise spatial information service built with 10m high resolution to scientifically visualize soil carbon storage in the local ecosystem.
This map was developed by integrating ground truth surveys conducted at 1,500 locations across Gyeonggi-do during a single period in 2024, biotope-based sampling design, near-infrared spectroscopy-based soil carbon prediction model, and digital mapping techniques. The map shows soil carbon storage for various ecosystem types, including forests, agricultural lands, wetlands, and urban green spaces. It is visualized and displayed in color.
A prediction model was learned based on the carbon element analysis results and near-infrared spectrum data of the collected soil samples, and then a high-resolution soil carbon storage distribution throughout Gyeonggi-do was derived through Digital Soil Mapping technology that reflected the weather, topography, and vegetation information of the survey site.
This thematic map was created based on the largest-scale ground truth survey in a single period and reflects information on the carbon content of soil, the main carbon reservoir in terrestrial ecosystems. Therefore, it can be used to establish policies to respond to climate change, plan urban and forest management, and make strategic decisions to achieve carbon neutrality. It also serves as an educational tool for citizens to understand the carbon storage status of each region and recognize the need for carbon neutrality.
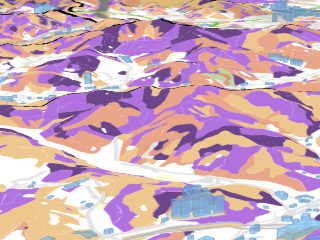
The Gyeonggi-do soil carbon storage map is precise spatial information constructed at 10m high resolution, providing a scientific basis for responding to climate change. It was created by applying the Digital Soil Mapping technique by integrating soil sample analysis results from 1,500 points surveyed in 2024, satellite-based vegetation data, and topography and climate information, and visualizes the soil organic carbon (SOC) distribution in color by various ecosystem types such as cities, forests, agricultural lands, and wetlands. This map can be used as key data for spatial-based decision-making to achieve carbon neutrality, such as establishing climate policy, ecosystem carbon assessment, and land use planning.
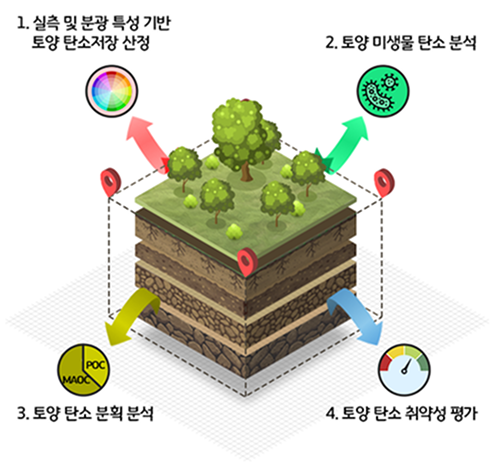
The soil microbial carbon storage map is a precise representation of the spatial distribution of microbial carbon (Microbial Biomass Carbon, MBC) accumulated by microbial communities in the soil. The 10m resolution map was created through a machine learning model based on actual measurements of microbial volumetric carbon storage, near-infrared reflection data, vegetation, and environmental variables, and can evaluate ecosystem functionality and biological carbon storage capacity throughout Gyeonggi-do. This map can contribute to diagnosing soil ecosystem health, assessing bio-based carbon stocks, and establishing bio-based carbon management strategies linked to biodiversity.
The soil carbon fractionation map is a thematic map that goes beyond simple carbon storage and distinguishes the functional stability and cycle characteristics of carbon. Soil carbon can be divided into Particulate Organic Carbon (POC), which can be easily decomposed by microorganisms, and Mineral-Associated Organic Carbon (MAOC), which is bound to the surface of minerals and is relatively stable. This map serves as key data for scientifically interpreting soil carbon storage stability, predicting management effectiveness, and carbon change responsiveness to climate change based on carbon fractionation analysis. By reflecting the qualitative carbon status of the soil, it overcomes the limitations of simple storage-based carbon assessment.
The soil carbon vulnerability map reflects the carbon fraction ratio and is the result of indexing the risk of soil carbon loss due to climate change. Areas with a high proportion of Particulate Organic Carbon (POC) and a low proportion of Mineral-Associated Organic Carbon (MAOC) have a relatively unstable carbon storage structure and are at high risk of carbon loss due to increased rainfall, increased temperature, and disturbances (cultivation, logging, etc.). This map is useful for identifying potential soil carbon losses, establishing management priority areas, and establishing risk-based soil conservation strategies, and provides a scientific basis for establishing adaptive climate policies that take into account the resilience of ecosystem carbon maintenance.
1 / 5
Status of Soil Carbon Storage in Gyeonggi-do
You can clearly understand the multifaceted soil carbon storage statistics of Gyeonggi-do and 31 cities and counties with cartograms and responsive graphs.
선택지역정보
Gyeonggi-do
경기도 내 의 Carbon Storage (Soil) 비율
%
경기도 내 의 Carbon Storage (Soil) 순위
/31위
Legend
Card Graph View
Carbon Storage (Soil)
Gyeonggi-do
경기도 Carbon Storage (Soil) 통계
선택할 수 있는 데이터
Table View
Carbon Storage (Soil)
Carbon Storage (Soil) Data (kgC)
| 선택 문구 |
|---|
| 선택된 시군/읍면동 또는 데이터가 없습니다. 시군/읍면동 또는 데이터를 선택하여 주십시오. |
Carbon Emissions
Gyeonggi-do Carbon Emissions (Buildings, Transportation)
As of 2023
0
tonCO2eqCarbon Emissions from the Building Sector
As of 2023
0
tonCO2eqTransportation Sector Carbon Emissions (Based on VKT)
As of 2023
0
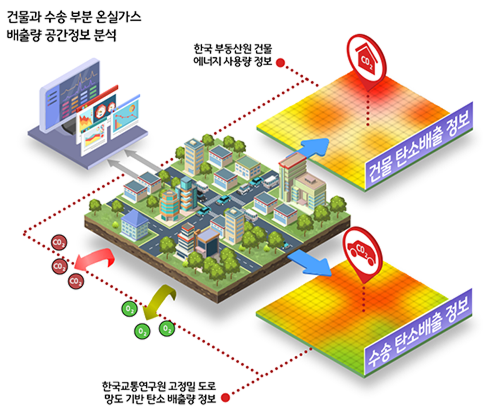
tonCO2eqCarbon Emissions Spatial Information
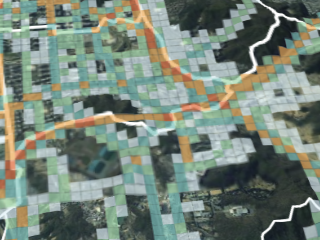
In order to respond to the climate crisis and achieve carbon neutrality, Gyeonggi-do provides a carbon space map that can accurately identify major greenhouse gas emissions. Carbon emissions arising from energy consumption and transportation activities are very unevenly distributed across regions, and detailed spatial-based analysis is essential to achieve the carbon neutrality goal. Accordingly, the Ministry of Land, Infrastructure and Transport established carbon emissions information for buildings and transportation, which are major carbon emissions areas, into spatial information in a 100m grid unit, and Gyeonggi-do established carbon emissions information on a building basis.
The building sector carbon emissions map is a spatialized data that converts electricity, gas, and district heating energy usage information provided by the Korea Real Estate Agency into a grid unit. This map analyzes energy consumption patterns and carbon emissions by month and year to identify high-emission areas and is used to establish regionally customized energy efficiency policies.
The transportation sector carbon emissions map is a transportation activity-based carbon map constructed by combining the road network, average speed by vehicle type, and vehicle registration status. We calculated VKT (vehicle traveling distance) using the Korea Transport Institutes high-precision road network map (Level 6), speed data, and vehicle registration data from e-Nara Index, and created a spatial map with 100m resolution by applying nationally recognized emission factors.
Gyeonggi-dos carbon emissions map intuitively identifies carbon emissions regions and provides key scientific basis for prioritizing energy transition, eco-friendly transportation, and establishing regional carbon neutral strategies.
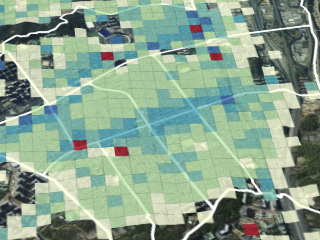
The Gyeonggi-do building carbon space map is a space-by-space visualization of carbon emissions activities by month and year, based on building information and energy usage data.
Building information based on building ledgers and electricity, gas, and heating energy usage data collected from KEPCO, city gas companies, and district heating corporations are matched based on address and converted to grid units to calculate carbon emissions.
This information is used as basic data for establishing space-tailored building energy policies and realizing a carbon-neutral city.
The Gyeonggi-do transportation carbon emissions map is supervised by the Ministry of Land, Infrastructure and Transport and is spatial information on carbon emissions based on transportation activities by year constructed in a 100m resolution grid by linking traffic volume, average speed, and vehicle registration status by vehicle type based on the road network.
Based on the Korea Transport Institutes road network map (Level 6), average speed data, and vehicle registration data, we calculated the activity level (VKT) by vehicle type and calculated emissions by applying fuel use by vehicle type, fuel type, and control technology and nationally recognized coefficients.
This data can be effectively used in establishing eco-friendly vehicle policies, low-carbon transportation infrastructure design, and carbon neutral strategies in the transportation sector.
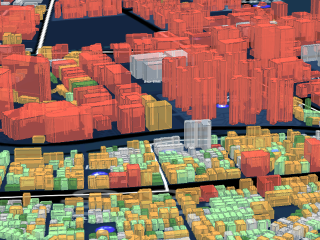
The Gyeonggi-do building carbon emissions map is spatial information that visualizes energy usage and carbon emissions for each building, based on the real estate agencys energy (electricity, gas, district heating) usage data at the unit number.
Carbon emissions were calculated by applying IPCC guidelines and national emission factors, and the high-resolution map can be used to identify energy-consuming buildings, establish carbon neutral policies, and select green remodeling targets.
1 / 5
Gyeonggi-do Carbon Emissions (Buildings, Transportation) Status
You can clearly understand the multifaceted carbon emissions statistics of Gyeonggi-do and 31 cities and counties with cartograms and responsive graphs.
선택지역정보
Gyeonggi-do
경기도 내 의 Carbon Emissions 비율
%
경기도 내 의 Carbon Emissions 순위
/31위
Legend [Unit tCO₂eq]
Card Graph View
Carbon Emissions (Buildings, Transportation)
Gyeonggi-do
경기도 Carbon Emissions (Buildings, Transportation) 통계
선택할 수 있는 데이터
Table View
Carbon Emissions (Buildings, Transportation)
Carbon Emissions Data (tonCO2eq)
| 선택 문구 |
|---|
| 선택된 시군/읍면동 또는 데이터가 없습니다. 시군/읍면동 또는 데이터를 선택하여 주십시오. |
Greenhouse Gas Inventory (Based on Direct Emissions VKT)
Direct Greenhouse Gas Emissions (Excluding LULUCF)
2022
0
GgCO₂eqEnergy
2022
0
GgCO₂eqIndustrial Processes and Product Production
2022
0
GgCO₂eqAgriculture
2022
0
GgCO₂eqLULUCF
2022
0
GgCO₂eqWaste
2022
0
GgCO₂eq*Source: Greenhouse Gas Information Center “Results of Pilot Calculation of Regional Greenhouse Gas Emissions in 2024 (2010-2022)”
Greenhouse Gas Inventory
The Starting Point of Gyeonggi-dos Climate Policy, Local Greenhouse Gas Emissions Management System
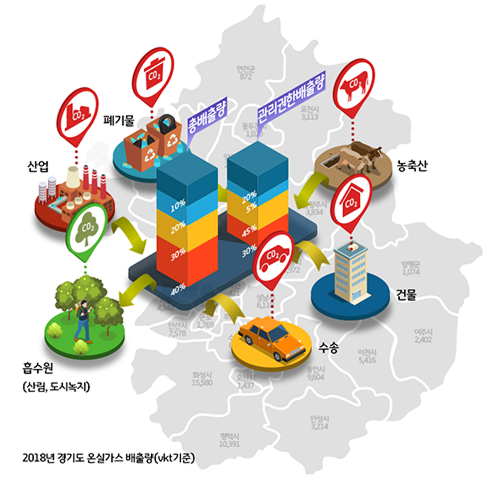
The local greenhouse gas inventory refers to a database that systematically researches and organizes the emissions and absorption of greenhouse gases generated at the local government level.
It is structured to quantitatively identify greenhouse gas emissions by region by comprehensively reflecting emissions from various sectors such as energy use, transportation, industry, waste, and agricultural and livestock products, as well as sinks such as forests and urban green spaces. This inventory is used as essential basic data to establish local-level carbon neutral policies and evaluate reduction implementation status.
Hosted by the National Greenhouse Gas Information Center (GIR), the greenhouse gas emissions of basic local governments, including 17 metropolitan local governments, are calculated and announced, and above all, this inventory is essential for establishing the local governments ‘Carbon Neutral Green Growth Basic Plan’. It serves as the basic data for establishing all plans, including setting greenhouse gas reduction goals, deriving reduction measures, and determining business priorities.
Local greenhouse gas emissions are largely divided into total emissions and management authority emissions. Total emissions include all greenhouse gas emissions generated within the region and encompass a variety of emission activities, including the power generation sector, industrial processes, buildings, transportation, and waste disposal. On the other hand, emissions with management authority refer only to emissions that local governments can directly manage or reduce through policy, and generally exclude the power generation sector (energy) and industrial sectors.
Gyeonggi-do Greenhouse Gas Inventory (Based on Direct Emissions)
You can clearly understand the multifaceted tree greenhouse gas inventory statistics of Gyeonggi-do and 31 cities and counties with cartograms and responsive graphs.
선택지역정보
Gyeonggi-do
경기도 내 의 Total Greenhouse Gas Emissions 비율
%
경기도 내 의 Total Greenhouse Gas Emissions 순위
/31위
Legend
Card Graph View
Greenhouse Gas Inventory (직접배출량 기준)
Gyeonggi-do
경기도 Greenhouse Gas Inventory 통계
선택할 수 있는 데이터
Table View
Greenhouse Gas Inventory (직접배출량 기준)
Greenhouse Gas Inventory Data (GgCO₂eq)
| 선택 문구 |
|---|
| 선택된 시군/읍면동 또는 데이터가 없습니다. 시군/읍면동 또는 데이터를 선택하여 주십시오. |
